Geopolitical instability in Iran threatens to shake the energy foundations of Europe. In the face of a possible escalation, the continent faces a critical dilemma: prioritize short-term supply security, even resorting to more polluting fuels, or decisively accelerate the green transition to reduce dependencies. This crisis exposes the vulnerability of a globalized supply chain and the urgency of making data-based strategic decisions.
3D Modeling of the Energy Supply Chain: Simulating Crisis Scenarios ⚡
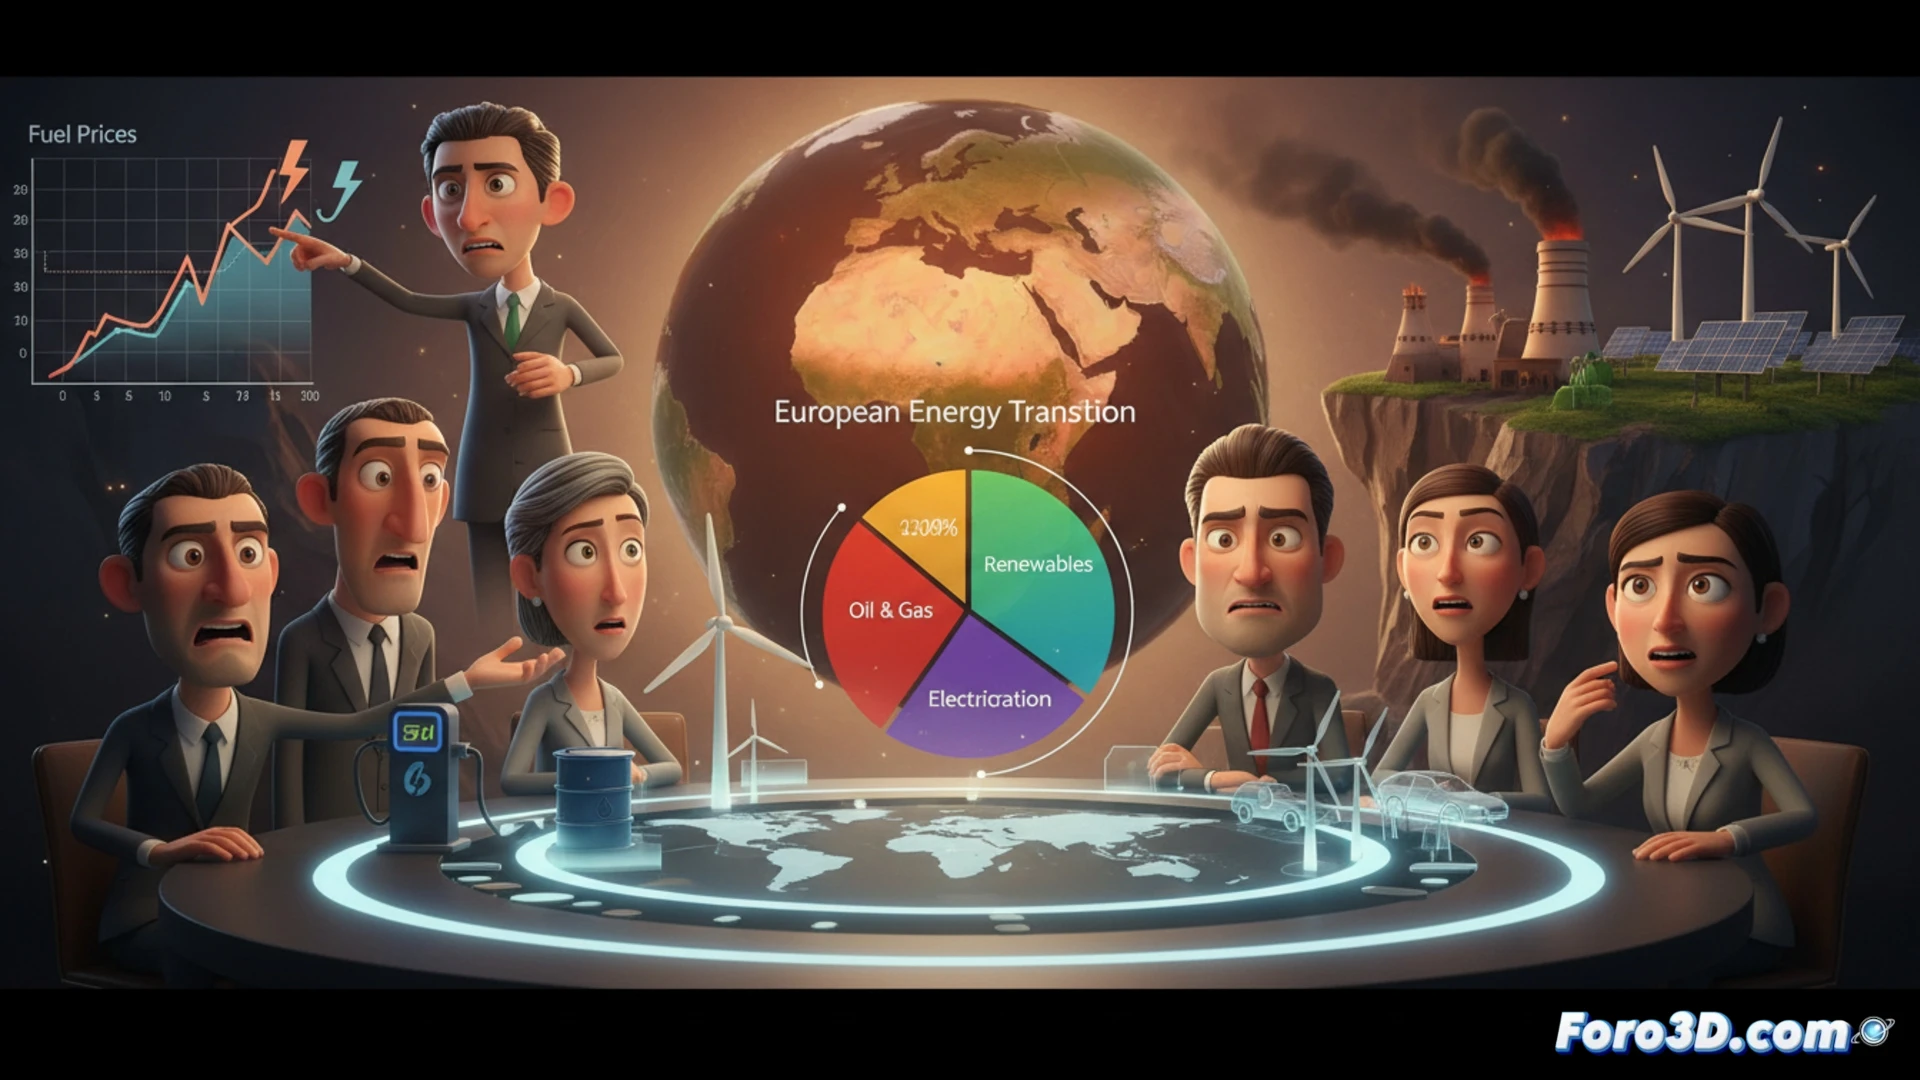
To navigate this uncertainty, 3D visualization and simulation tools are key. An interactive model of the European energy network can be built, mapping gas, oil, and electricity flows, critical infrastructure, and bottlenecks. This model would allow simulating specific scenarios: a blockade in the Strait of Hormuz, expanded sanctions, or disruptions in gas pipelines. By altering variables, the impact on prices, storage capacity, and energy mix would be visualized, quantifying how each crisis could force faster electrification or, conversely, a return to coal. It is a forecasting tool for planning resilience.
Data Visualization as a Compass in the Geopolitical Storm 🧭
Ultimately, the conflict can be a painful catalyst. Dependence on imported fossil fuels is a strategic vulnerability. Simulation models do not predict the future, but they illuminate the consequences of each political decision. By clearly visualizing the costs and risks of each path, they help transcend short-termism. The crisis underscores that true energy security no longer lies in the geopolitics of gas, but in the autonomy provided by renewables and efficiency.
How would you visually represent the concentration of manufacturing in Taiwan?