A recent study in the United Kingdom, the Netherlands, and Italy reveals that gas stoves can release benzene, a carcinogenic compound linked to leukemia, directly into homes. Nearly 10% of the homes analyzed showed leaks with concentrations exceeding safe exposure limits. These levels in Europe are notably higher than those recorded in the United States, adding a significant source of indoor pollution to which we are exposed daily without being aware.
3D Visualization of Contaminant Dispersion and Accumulation 🌀
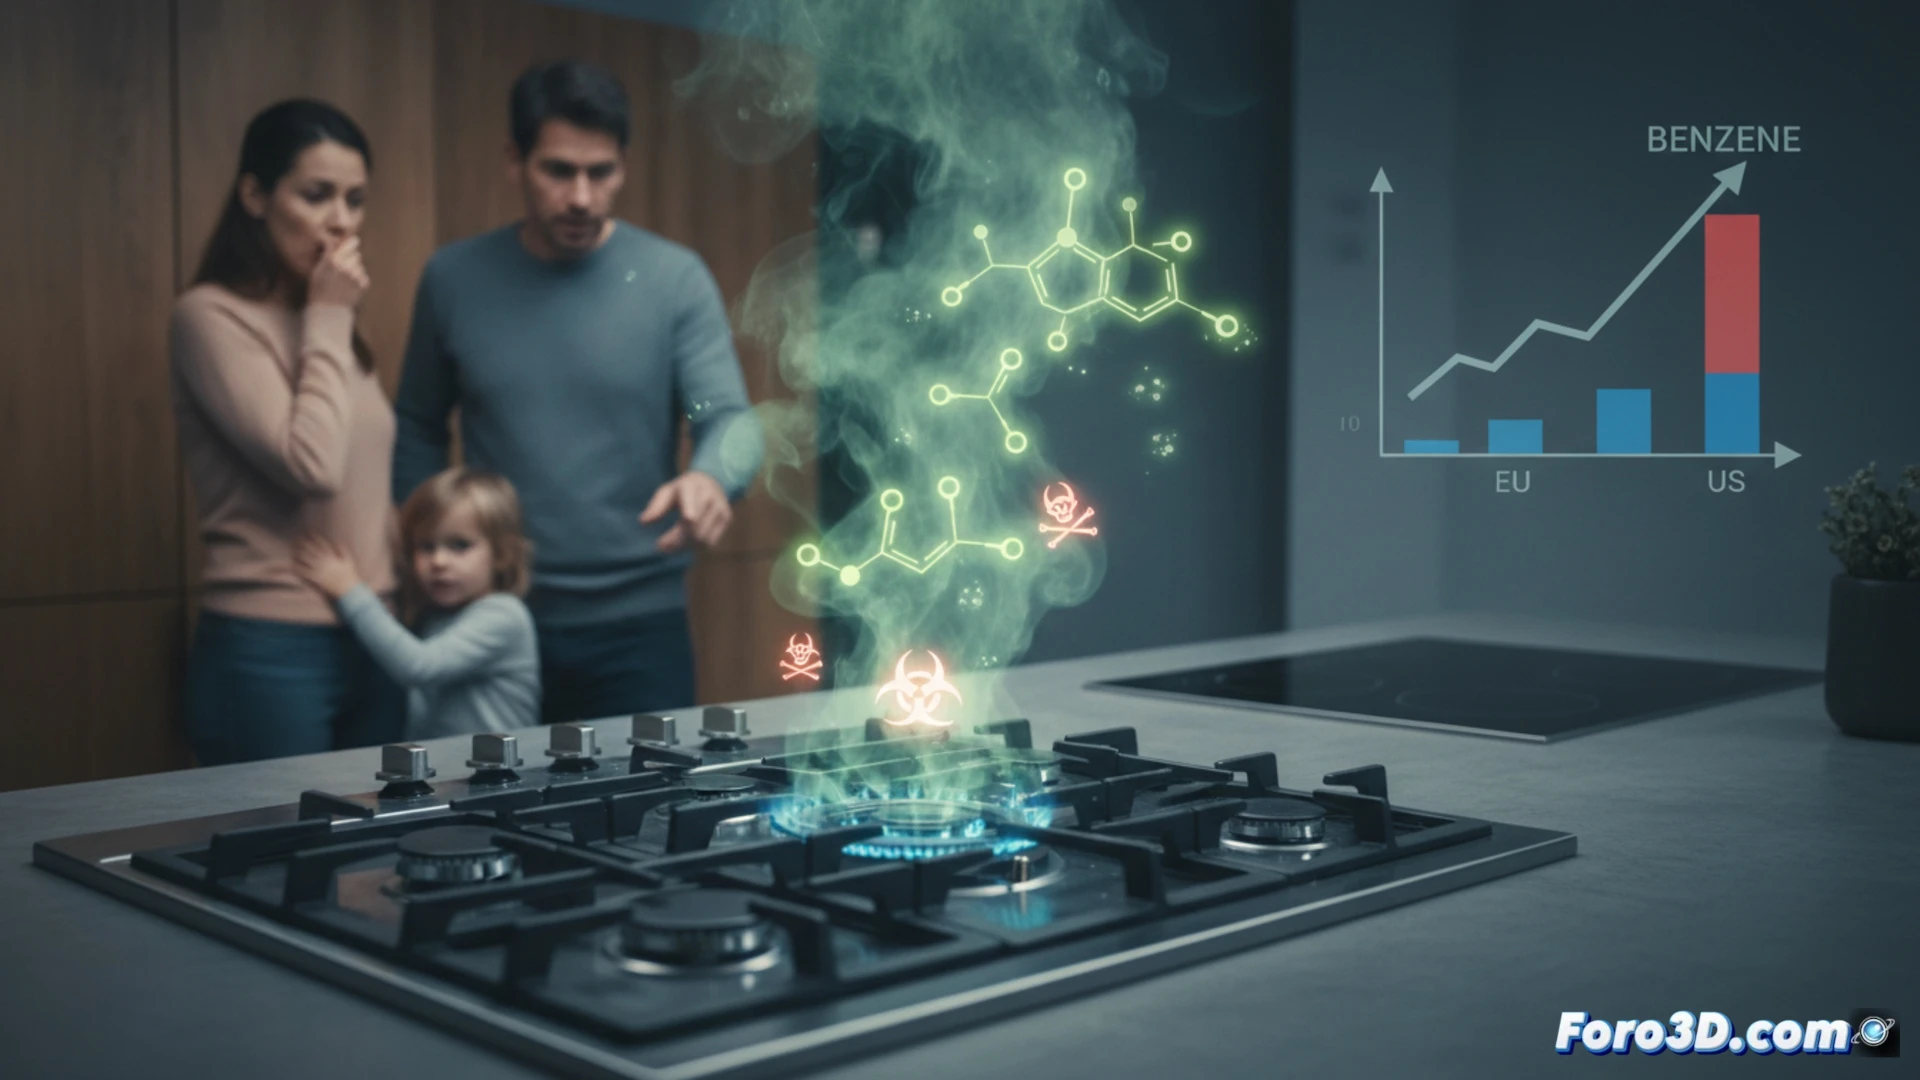
To understand the magnitude of the risk, we propose an interactive 3D visualization. It models a home in cross-section, showing how a leak in the stove connection releases benzene that disperses through the room. The simulation allows observing the progressive accumulation of the compound in the indoor air over time, especially in areas with poor ventilation. This tool is complemented by an incidence map from the European study, highlighting the analyzed areas, and a comparative chart that clearly visualizes benzene concentration levels in gas between European countries and the United States.
Towards a Safer and More Sustainable Home 🌱
The evidence on indoor air pollution from gas stoves is increasingly solid. There is no safe level of benzene exposure, so these leaks, added to other sources, represent a real risk to public health. Experts emphasize the need for a transition to safer alternatives, such as induction stoves. This change would not only reduce exposure to carcinogens in the home but also decrease carbon emissions, protecting both individual health and the planet.
How can we use epidemiological data visualization to quantify and communicate the real risk of benzene exposure in homes with gas stoves?
(P.S.: visualizing obesity in 3D is easy, the hard part is making it not look like a map of planets in the solar system)