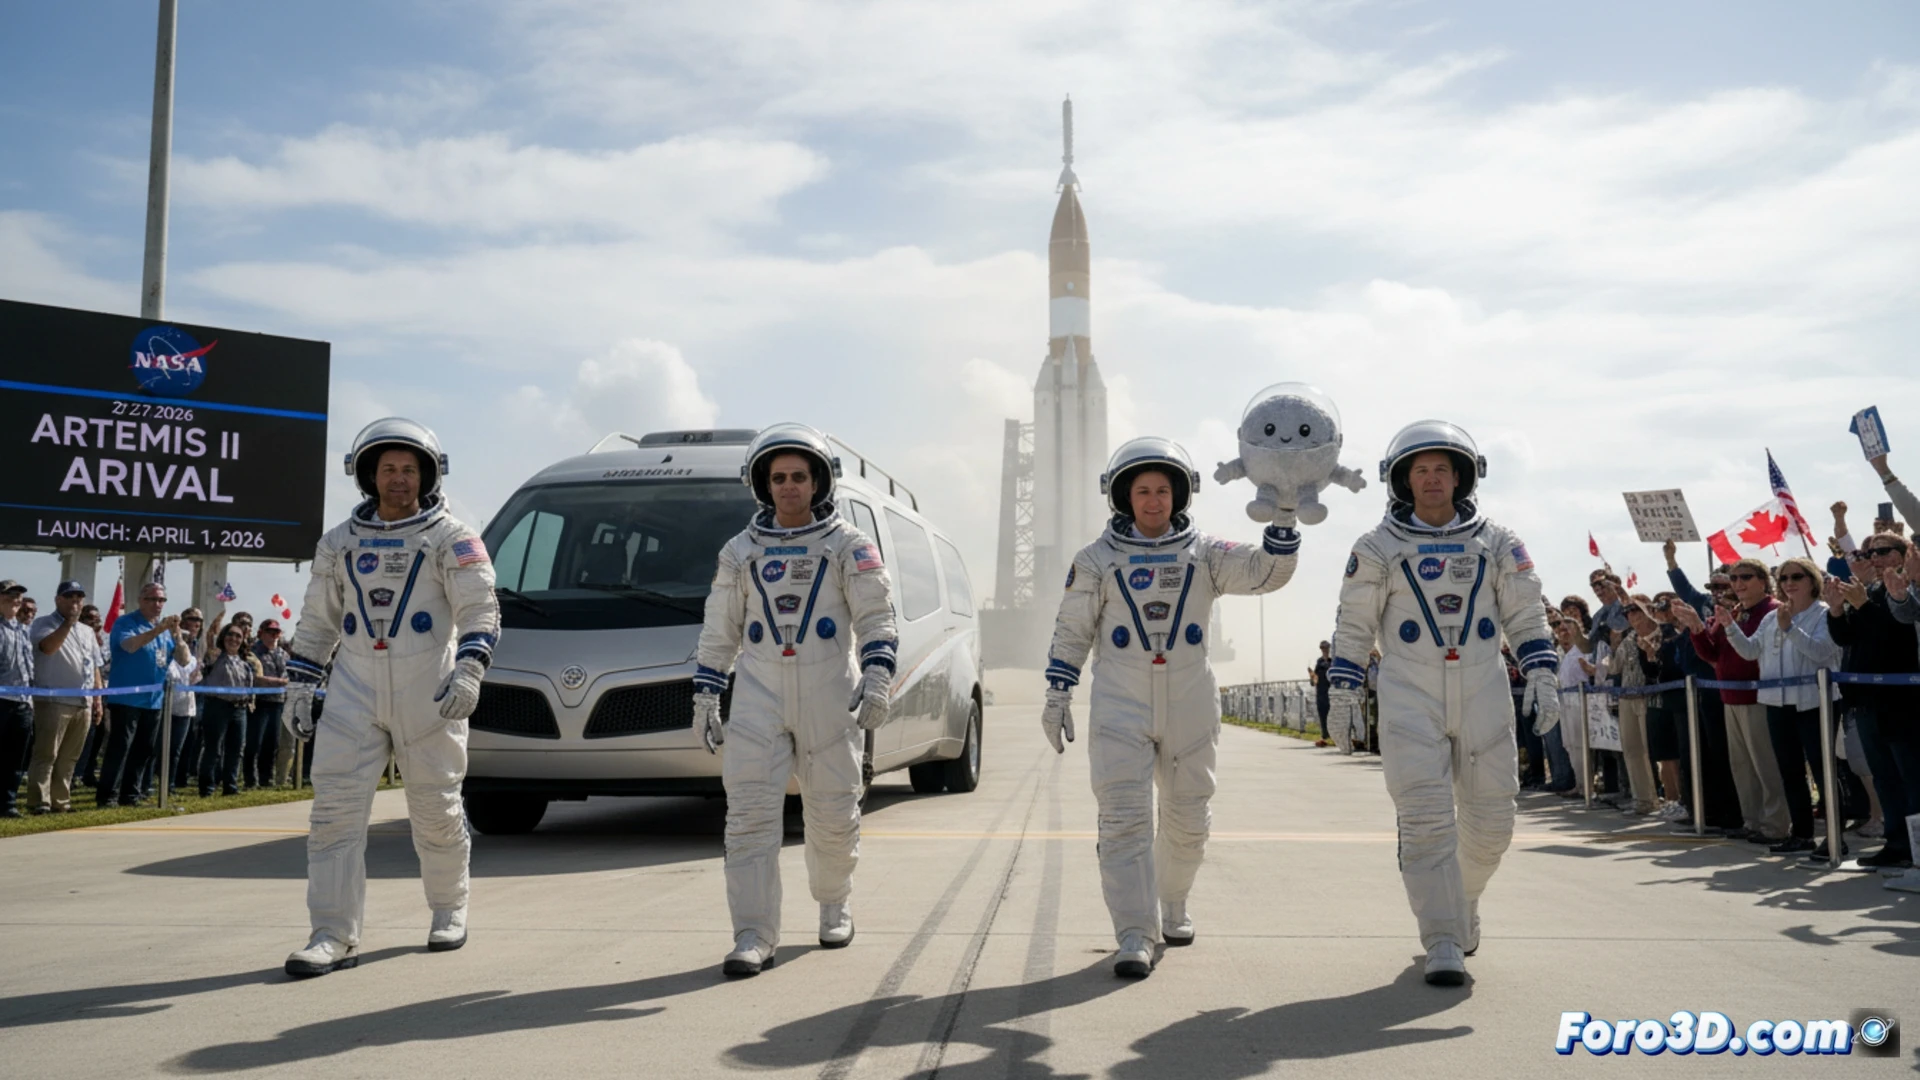
Humanity's return to the Moon now has a date. The Artemis II crew has arrived at Kennedy Space Center for final training before launch, scheduled for April 1. This historic mission, the first crewed flight to lunar orbit in over half a century, is not just an exploration milestone. It represents an exceptional opportunity for scientific visualization, transforming trajectory and spacecraft data into comprehensible and inspiring visual narratives for the global public.
From Data to Experience: 3D Modeling of the Mission 🚀
The complexity of Artemis II begs to be visualized. 3D modeling tools can break down each phase of the mission. We can create interactive infographics of the Orion spacecraft's trajectory, showing its journey to lunar orbit and return. Detailed technical models of the SLS rocket and capsule allow explaining their architecture and function. Even the precise lunar orbit, or the symbolic zero-gravity indicator flight Rise, can be represented in animations that illustrate physical concepts like microgravity, making the abstract tangible for outreach.
Visualization as a Bridge for Outreach 🌉
Beyond the technical, scientific visualization builds an emotional bridge. By transforming telemetry and blueprints into dynamic visual experiences, we bring the public closer to the feat. It's not just about showing a rocket, but visually narrating an epic journey. This approach is crucial for communicating the relevance of Artemis II, inspiring new generations and justifying the collective effort, turning space science into a visual story shared by all.
How are scientific visualization techniques used to simulate and analyze orbital trajectories and radiation risks in the Artemis II mission?
(P.S.: if your manta ray animation doesn't excite, you can always add documentary music from Channel 2)