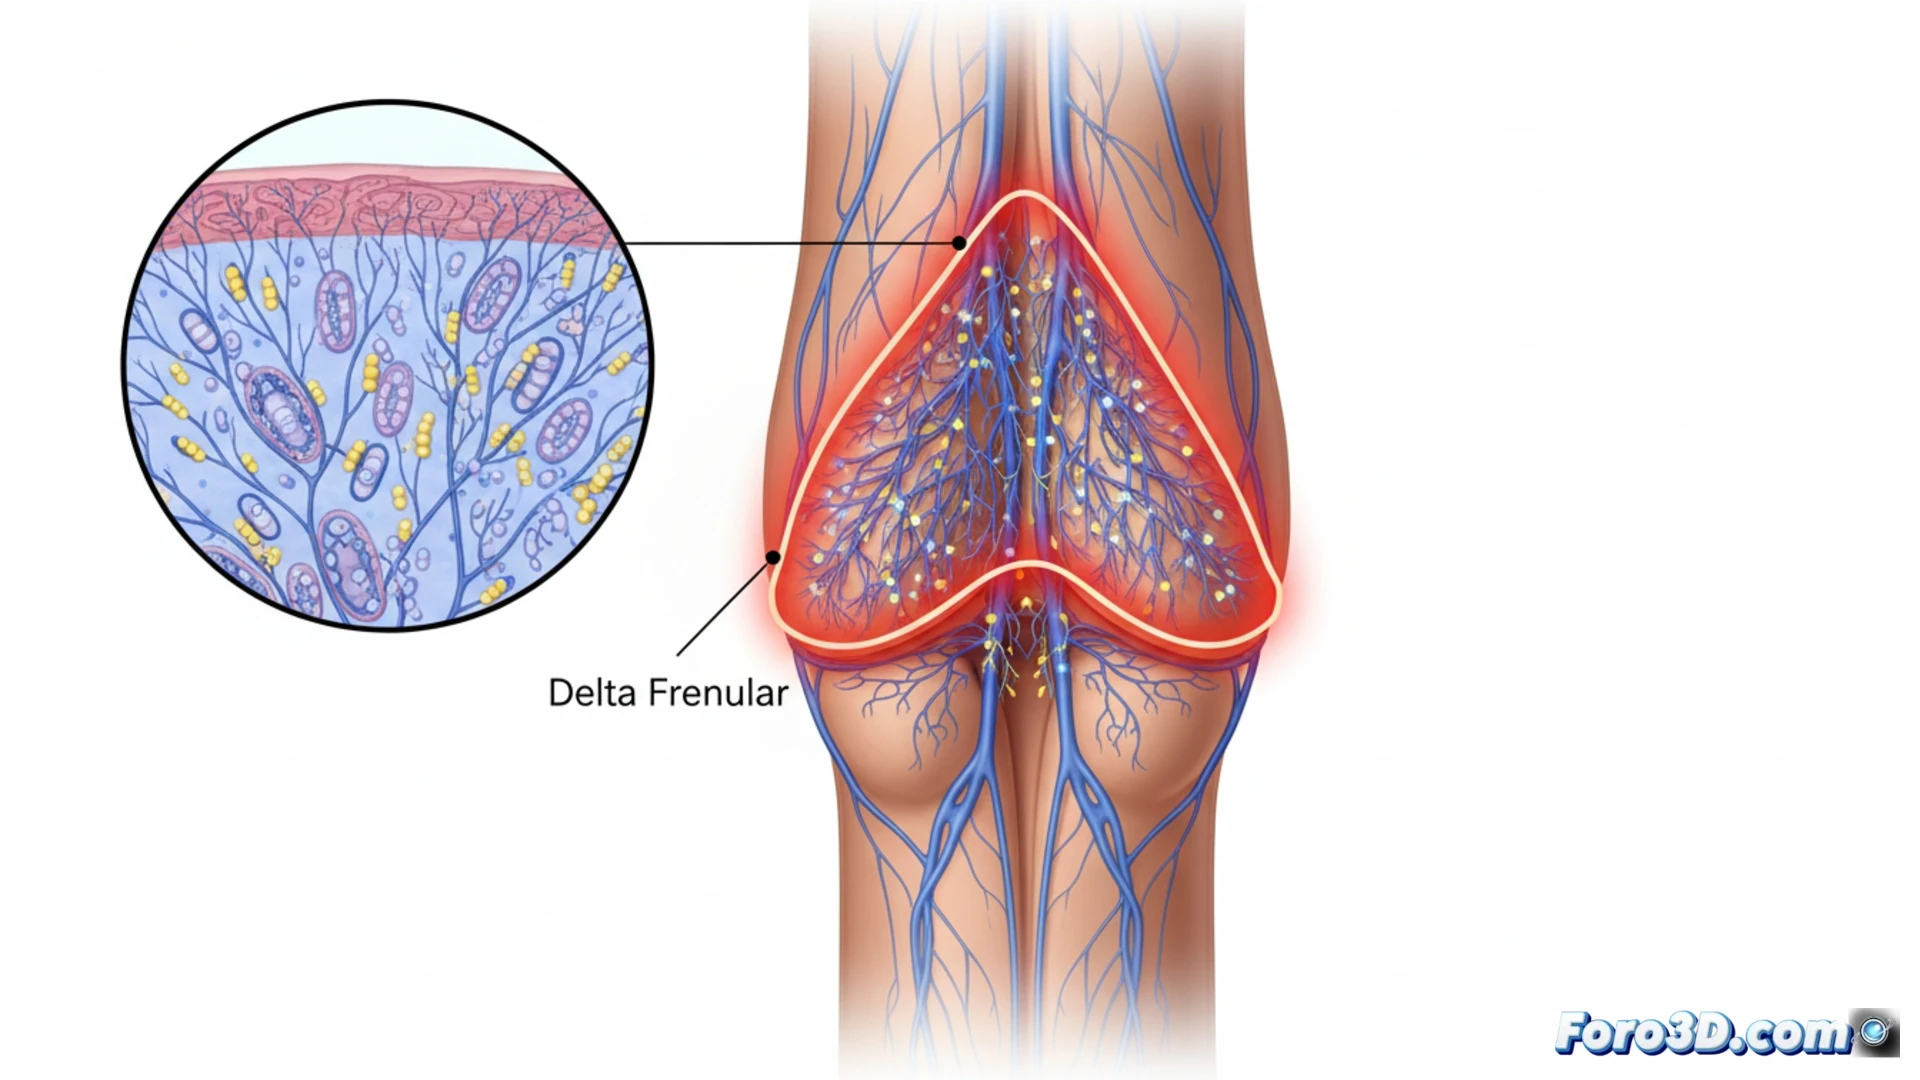
A recent neuroanatomical study has identified, through advanced scientific visualization techniques, the main erogenous zone of the penis: the frenular delta. This triangular structure, located at the ventral junction of the glans with the body, presents the highest density of nerve endings. The finding, scientifically validated, was made possible thanks to 3D modeling from microscopic data, precisely mapping the distribution of sensory receptors and overcoming the limitations of traditional anatomical atlases.
Methodology: from histology to interactive 3D model 🔬
The research was based on a technical process of digitization and three-dimensional reconstruction. Starting from tissue samples analyzed under the microscope, a systematic acquisition of histological data was performed. These data were segmented to identify and label specific nerve structures. Subsequently, using scientific visualization software, a rendered 3D model was generated that allowed visualizing the nerve density as a heat map or a point cloud. This spatial reconstruction was crucial to define the boundaries of the frenular delta as a discrete anatomical entity and quantify its superior innervation density compared to the rest of the glans.
Impact of visualization on science and outreach 🚀
This case underscores the transformative role of 3D visualization in anatomical research. Translating complex microscopic data into an interactive visual model not only facilitates discovery but also improves knowledge communication. The generated model serves as a powerful outreach tool, making a specialized finding accessible and allowing evaluation of the impact of interventions such as circumcision. Thus, the visualization technique emerges as an essential bridge between basic science and its public understanding.
How are 3D scientific visualization techniques revolutionizing the understanding of the neuroanatomy of peripheral organs like the penis?
(PS: fluid physics for simulating the ocean is like the sea: unpredictable and you always run out of RAM)