The regional elections in Baden-Württemberg, a key thermometer for German politics, highlight the constant need for clarity in democratic processes. In a context of citizen concern about the economy and debates on migration policies, 3D technology emerges as a powerful tool. Its ability to transform complex data into intuitive visual experiences can bring politics closer to people, making electoral results, participation, or the impact of government decisions more comprehensible.
Interactive 3D modeling to break down electoral results 📊
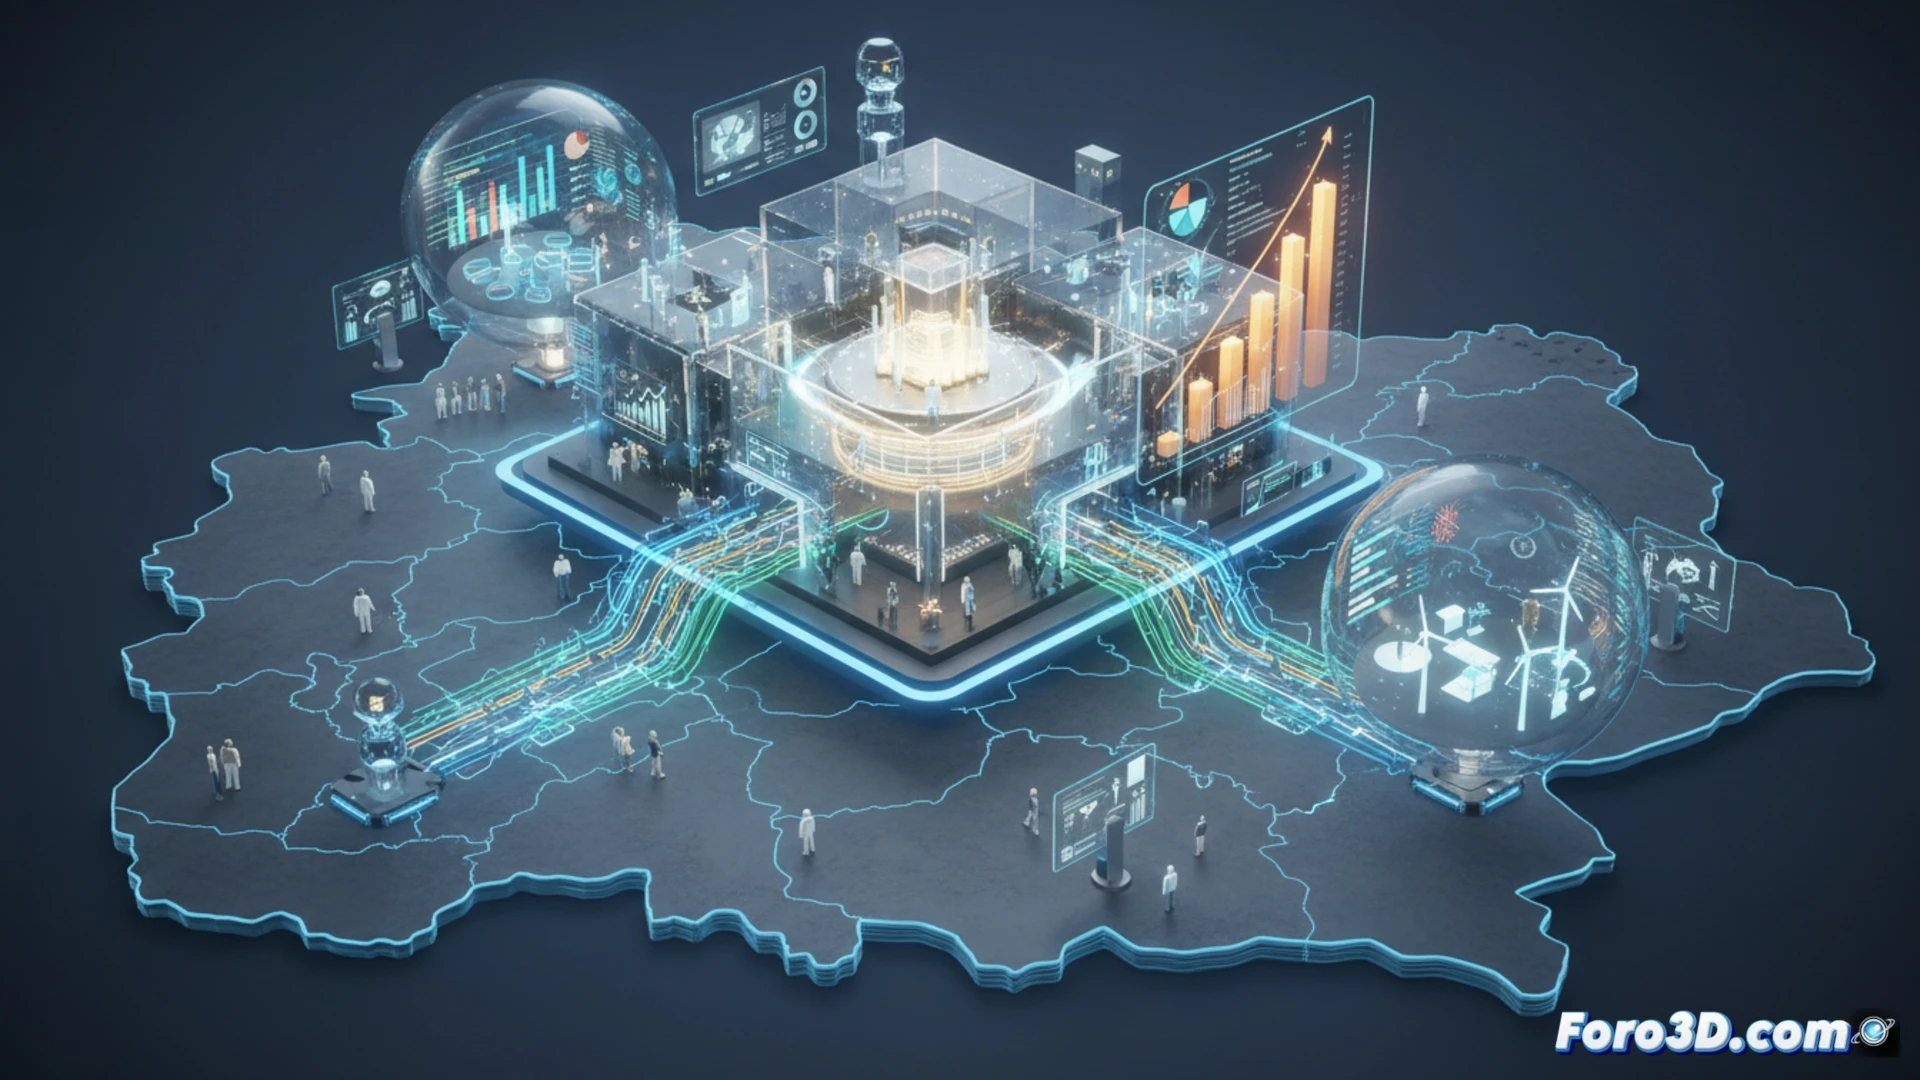
Imagine a georeferenced 3D map of Baden-Württemberg where, in real time, results are visualized by district with columns of variable height according to turnout or color according to political trend. The user could zoom in, isolate demographic data layers, or compare with past elections using a temporal slider. This application goes beyond the classic bar chart, allowing deep spatial and temporal analysis. Similarly, for topics like deportations, a 3D simulation of flows and administrative procedures could immediately identify bottlenecks, promoting accountability based on clear visual evidence.
Beyond the vote: immersive civic education 🕶️
The proposed technology is not only useful for election day. Virtual environments could recreate demonstrations like the one in Berlin for Iran, contextualizing them historically, or simulate the consequences of different economic policies in a virtual home, directly linking the vote to everyday impact. This approach turns citizen participation into a tangible experience, fostering a more informed and connected democracy, where the visualization of complex data ceases to be a technical privilege to become an accessible civic right.
What software do you recommend for creating real-time electoral tracking dashboards?