A recent study, based on the analysis of satellite data and ocean modeling, has detected a gradual northward shift of the Gulf Stream. This movement, of about 50 kilometers in three decades, is a measurable signal of the weakening of the Atlantic Meridional Overturning Circulation (AMOC). This current is fundamental to Europe's temperate climate, and its slowdown, attributed to the influx of freshwater from Greenland's ice melt, could have severe climatic consequences. Scientific visualization is key to interpreting these changes.
From raw data to simulation: visualizing ocean dynamics 🌊
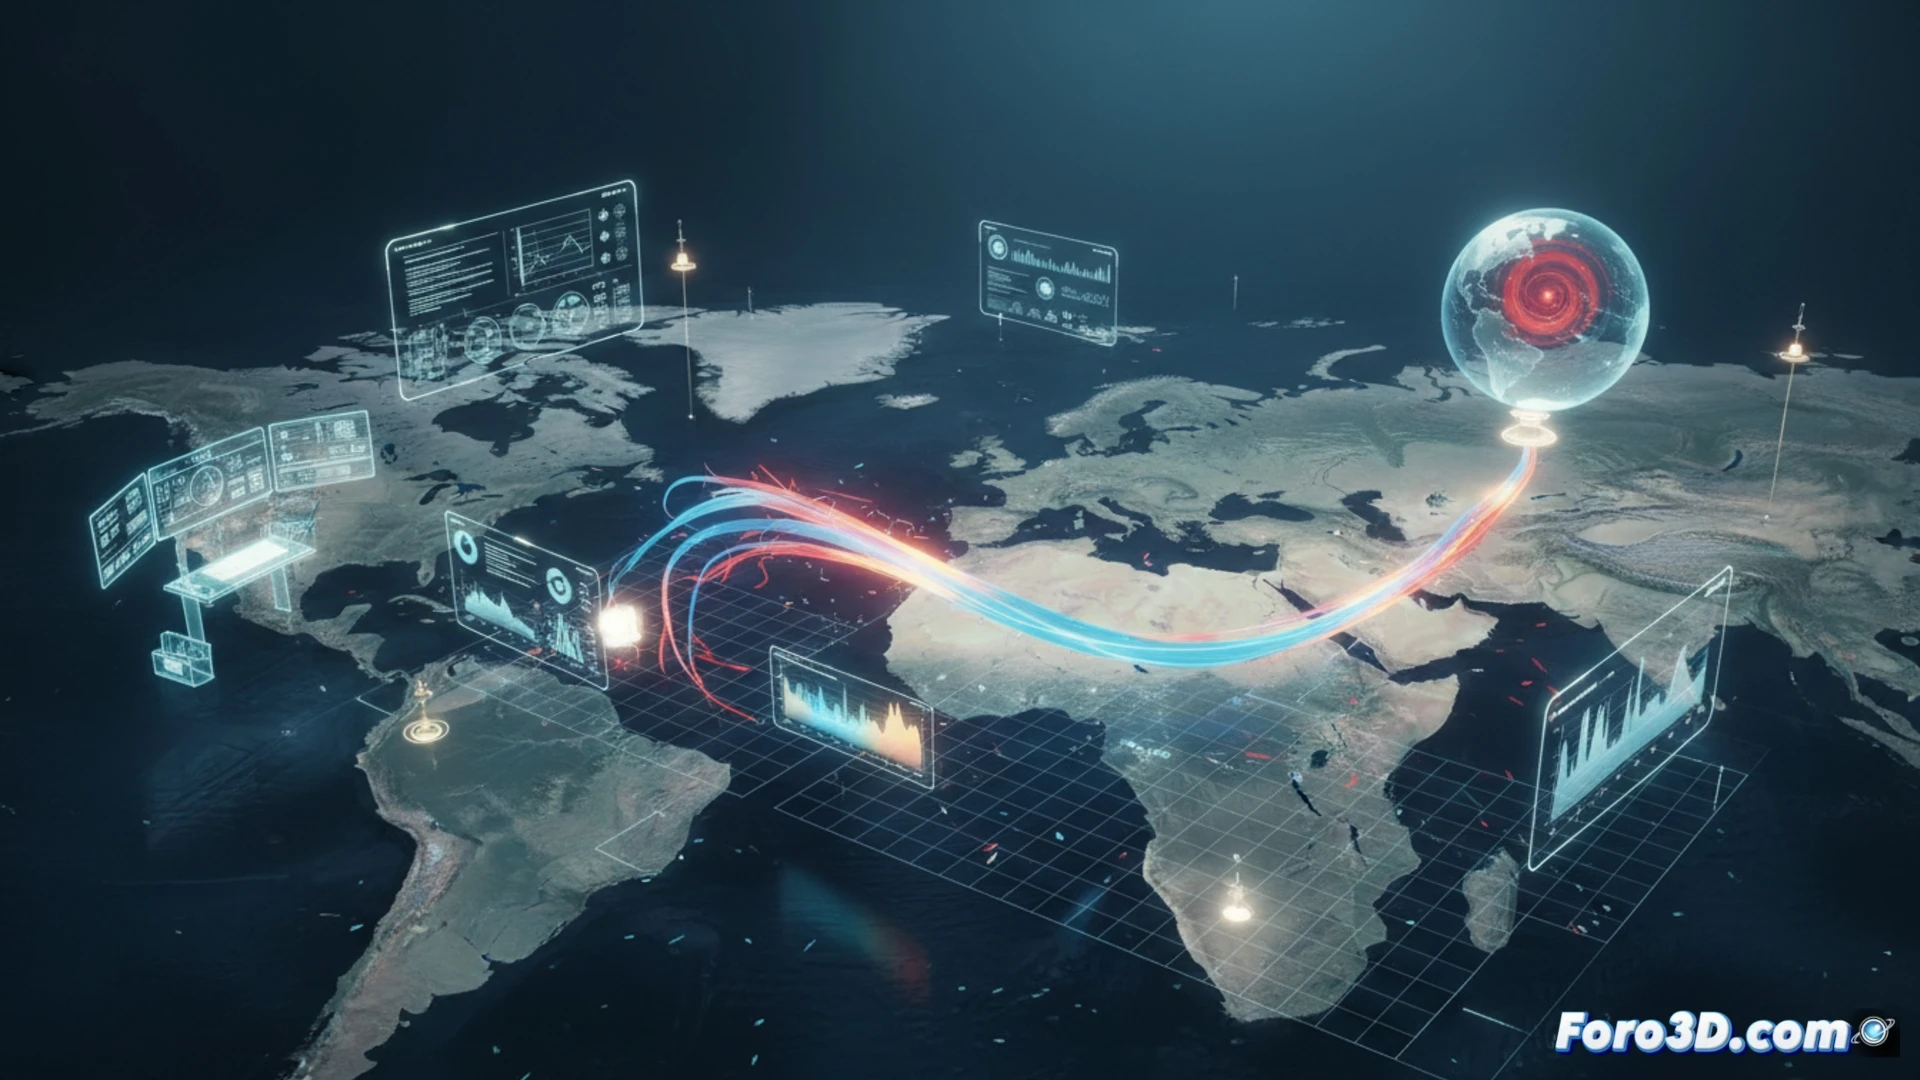
The understanding of this phenomenon arises from translating complex data into visual models. Information from satellites, buoys, and ocean sensors on temperature, salinity, and velocity is integrated into numerical simulation systems. These tools generate 3D representations and animations that allow scientists to observe the trajectory, density, and flow of water masses on a planetary scale. Without these visualizations, it would be almost impossible to identify subtle patterns such as the northward shift of the current or estimate the 15% reduction in AMOC flow since 1950. The model acts as a digital laboratory.
Beyond the graph: modeling to anticipate and communicate 🔮
The true power of modeling and 3D visualization lies in its prospective and outreach capabilities. These simulations not only diagnose the present but project future scenarios, such as the risk of an abrupt system collapse. For decision-making, presenting a visual model of climatic consequences is more impactful than a simple data table. In forums like this, we understand that good scientific visualization is the essential bridge between the complexity of research and the urgent need for informed action.
What level of anatomical detail would you need to faithfully represent this species?