The Madrid derby left a clear image: Vinícius Júnior overcame his historic drought against Atlético with a decisive double. This personal milestone, achieved after just one goal in 19 previous matches, is a perfect case study for 3D analysis tools. Beyond the sports chronicle, we can break down his performance using advanced visualization technologies to technically understand how he broke the pattern.
3D Reconstruction and Biomechanical Analysis of Key Plays 🎯
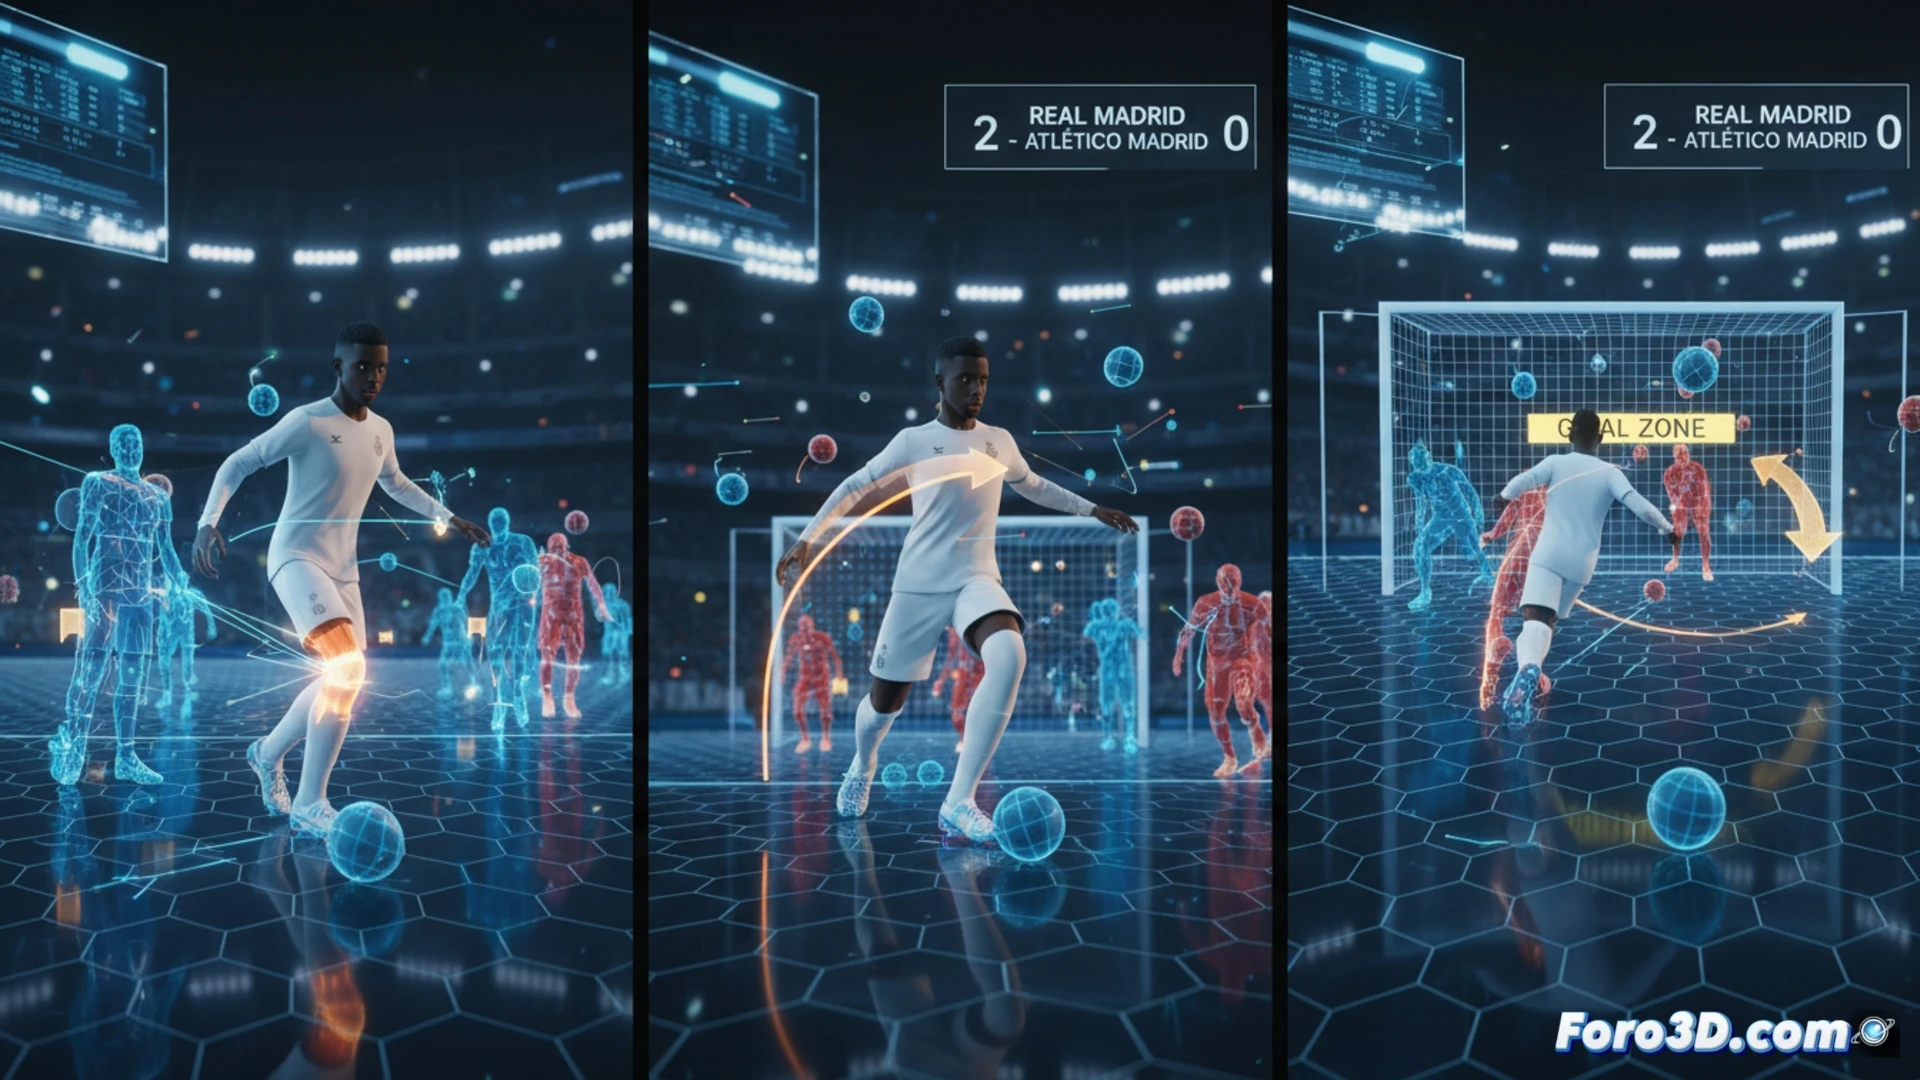
3D technology allows recreating the space and time of his goals. For the penalty, a 3D biomechanical model would analyze his run-up, foot support, and ball contact angle, comparing it to past failed attempts. The winning goal could be simulated in a 3D tactical environment, mapping his off-ball movements, runs, and synchronization with teammates. Additionally, an interactive 3D dashboard would contrast his pressure data, sprints, and zones of influence in this match versus previous encounters, visualizing the performance change.
Data Visualization: From Historic Drought to Peak Form 📊
The true power of 3D lies in data storytelling. A temporal 3D model could show an evolutionary heat map of his 20 matches against Atlético, where only two points shine with intensity: his first goal and this double. This visualization transforms the anecdote into objective analysis, allowing coaches and analysts to identify the contextual and tactical factors that coincided on the day of his personal breakthrough.
How can 3D analysis of biomechanics and ball trajectory reveal the technical keys to Vinícius's double that broke his curse in the derby?
(PS: VAR in 3D: now with replays from angles that didn't even exist)