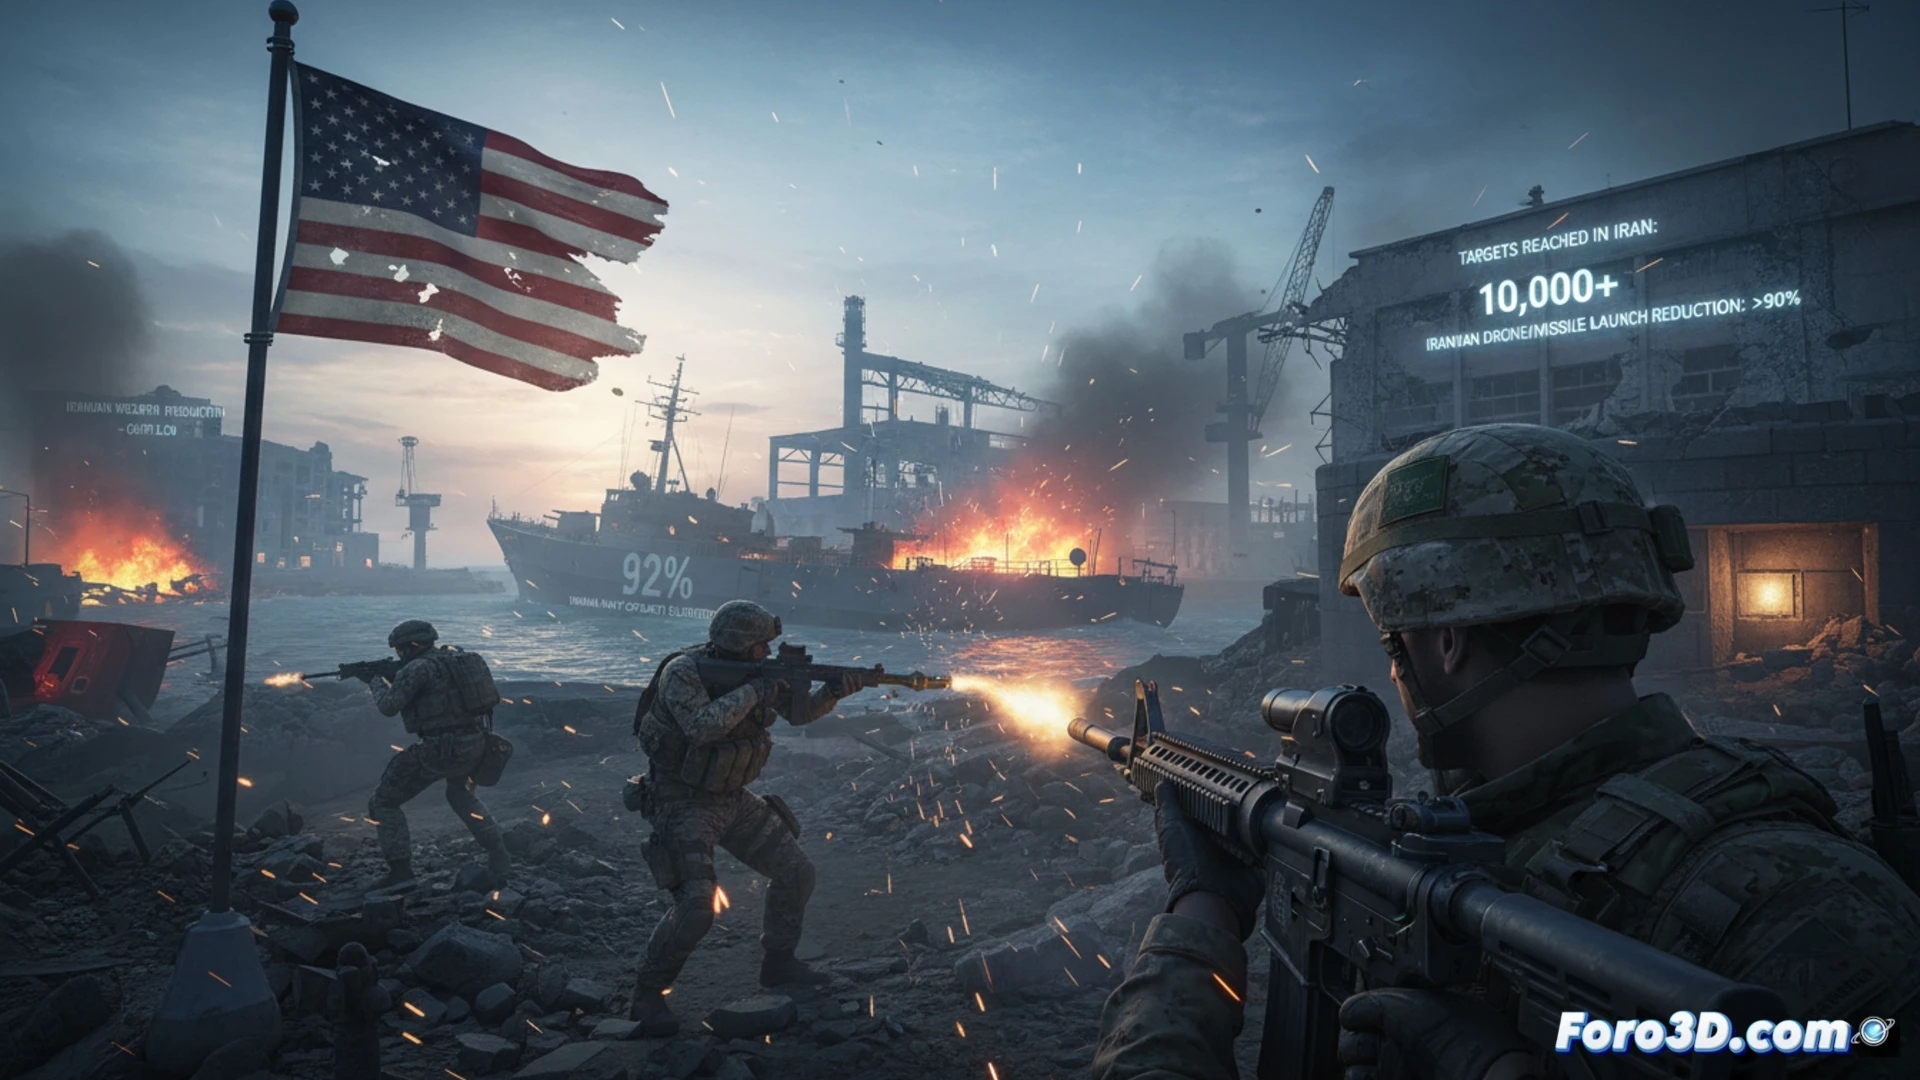
The CENTCOM announcement regarding the destruction of 92% of the main Iranian fleet marks a quantifiable turning point. For our community, these data are not just figures: they are the basis for 3D reconstructions and technical simulations. We can model the loss of naval projection capacity, visualize the layout of sunk or damaged ships, and create spatial representations that explain the real strategic impact of these losses, going beyond the military statement.
Geospatial visualization and simulation of defense saturation 🎯
The key lies in transforming data into visual experiences. An interactive 3D map with over 10,000 geolocated targets would reveal attack patterns and priorities. Additionally, a dynamic simulation of the 90% reduction in drone launches is crucial: we can model integrated air defense networks and simulate their collapse due to saturation. The destruction of shipyards and factories, which makes reconstruction impossible, can be shown through comparative models of facilities before and after, using damage scanning and reconstruction techniques applied to satellite images.
From data to spatial understanding of the conflict 🗺️
This case highlights how 3D modeling turns tactical information into tangible strategic knowledge. Visualizing the neutralization of a navy or the collapse of an air defense provides a deep and intuitive understanding of the correlation of forces. It invites analysis not only of what was destroyed, but of the remaining strategic options, using our tools to offer a unique technical perspective on the evolution of modern conflicts.
How can the tactical effectiveness and real material damage of an offensive that claims to have neutralized 92% of a main naval fleet be reconstructed and analyzed in 3D?
(P.S.: at Foro3D we document war damages with the same precision as our meshes: millimetric)