Radioastronomical deviation is a critical phenomenon that distorts signals captured by radio telescopes as they pass through plasma clouds and magnetic fields in space. To understand this effect, scientists turn to 3D visualization, transforming complex spectral data into interactive volumetric models. This technique allows tracking the path of radio waves and quantifying their angular deviation, offering a tangible representation of how the interstellar medium alters our perception of the cosmos. 🌌
Propagation Modeling and Interstellar Density Maps 🛰️
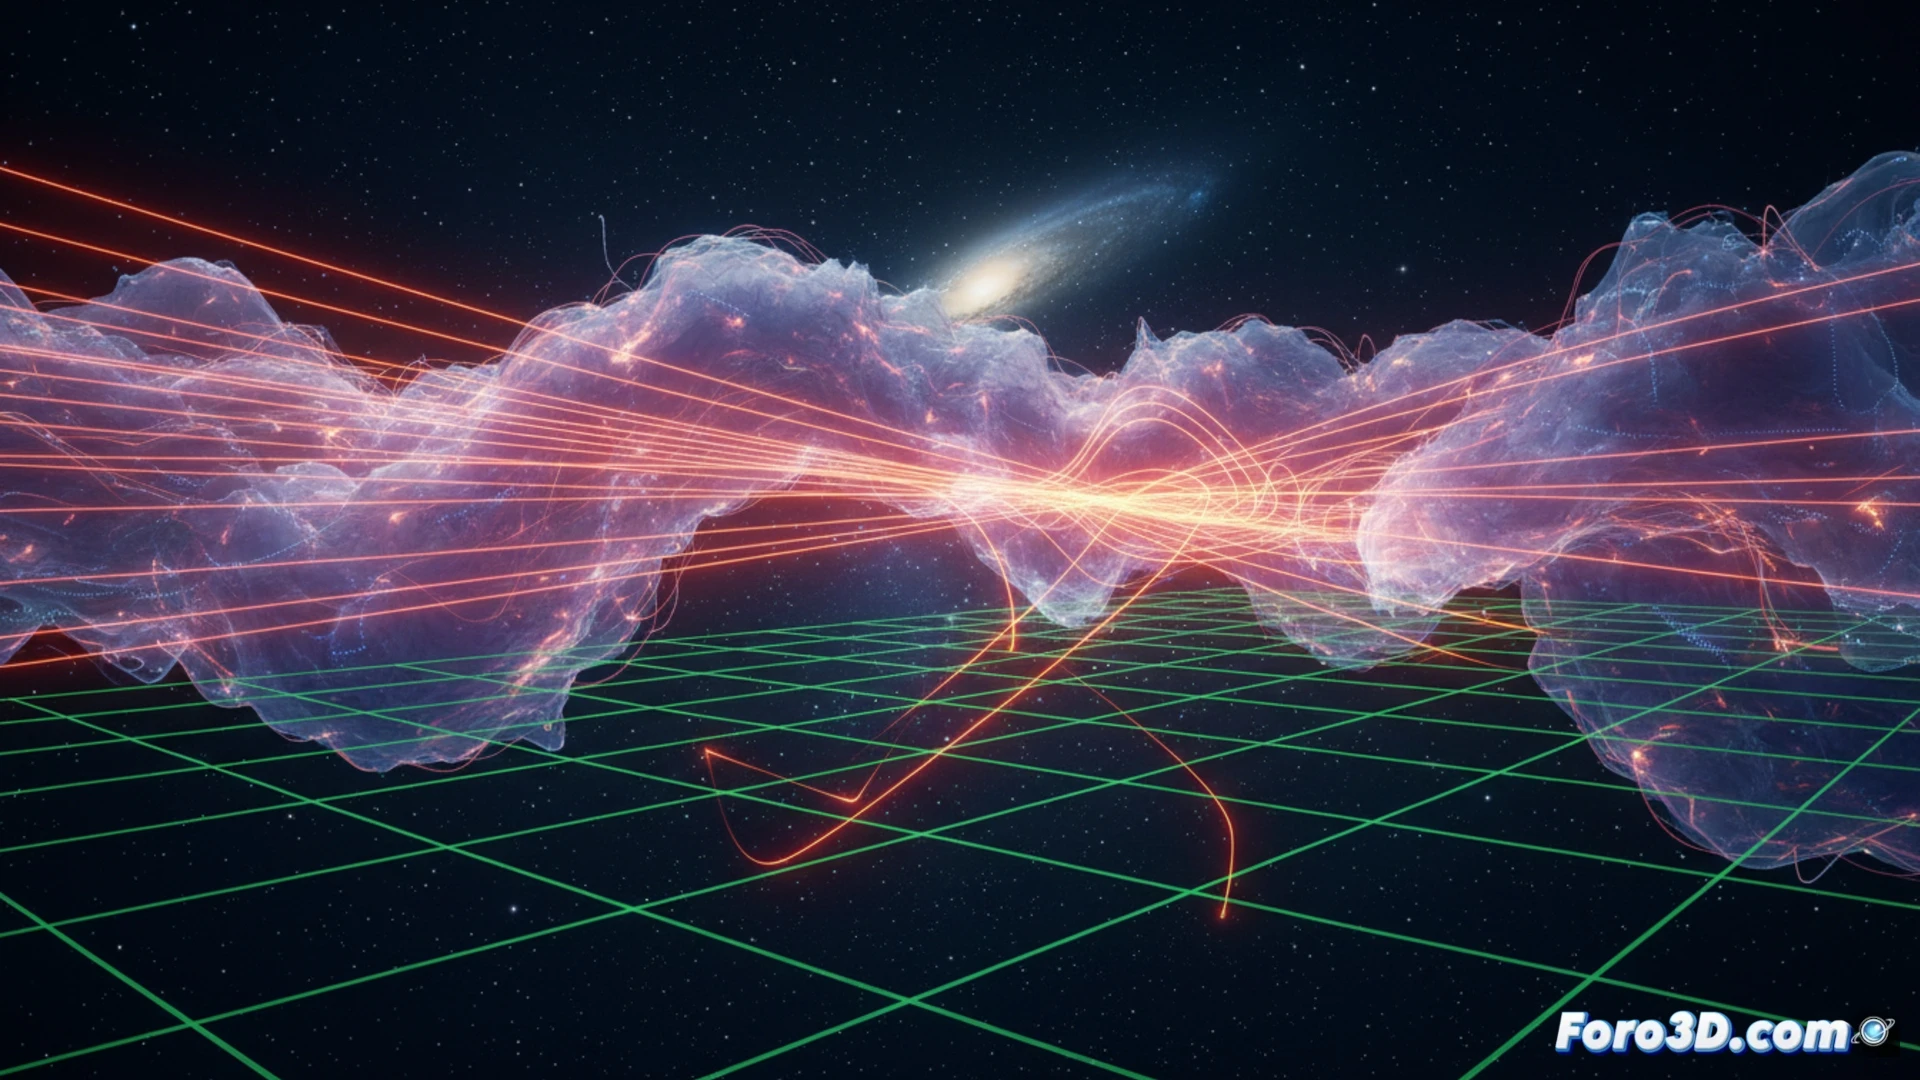
The process begins with importing data cubes from radio telescopes such as the VLA or ALMA, which contain intensity and phase measurements per frequency. In software like ParaView, ray tracing filters are applied to simulate wave propagation through a scalar field of electron density. Using tetrahedral meshes and refraction algorithms, it visualizes how waves bend when crossing high-density regions. Complementarily, in Blender with the Molecular Script addon, volumetric maps of interstellar matter are generated showing areas of greatest deviation, allowing the animation of the signal's journey from a distant source to the telescope dish.
The Need for Abstraction to Understand the Invisible 🧠
Radioastronomical deviation is invisible to the human eye, but its effects are measurable in the apparent position of pulsars or in the distortion of gravitational lenses. By converting this data into 3D animations, researchers not only validate theoretical models but also communicate complex findings to a non-specialist audience. Scientific visualization thus becomes a bridge between raw data and physical intuition, revealing patterns that would otherwise remain hidden in tables of numbers.
What are the main technical challenges when modeling in 3D the curved path of an interstellar radio wave due to differential refraction in ionized gas clouds?
(PS: if your manta ray animation doesn't excite, you can always add documentary music from channel 2)