The recent jam incident in a robotic pharmacy is not just a technical anecdote, but a perfect case study for industrial logistics. In this article, we analyze how 3D visualization allows us to identify the exact point of blockage in the medication flow, from the automated warehouse to the final dispenser, offering a roadmap for system optimization.
Mapping the logistics flow and blockage point 🚧
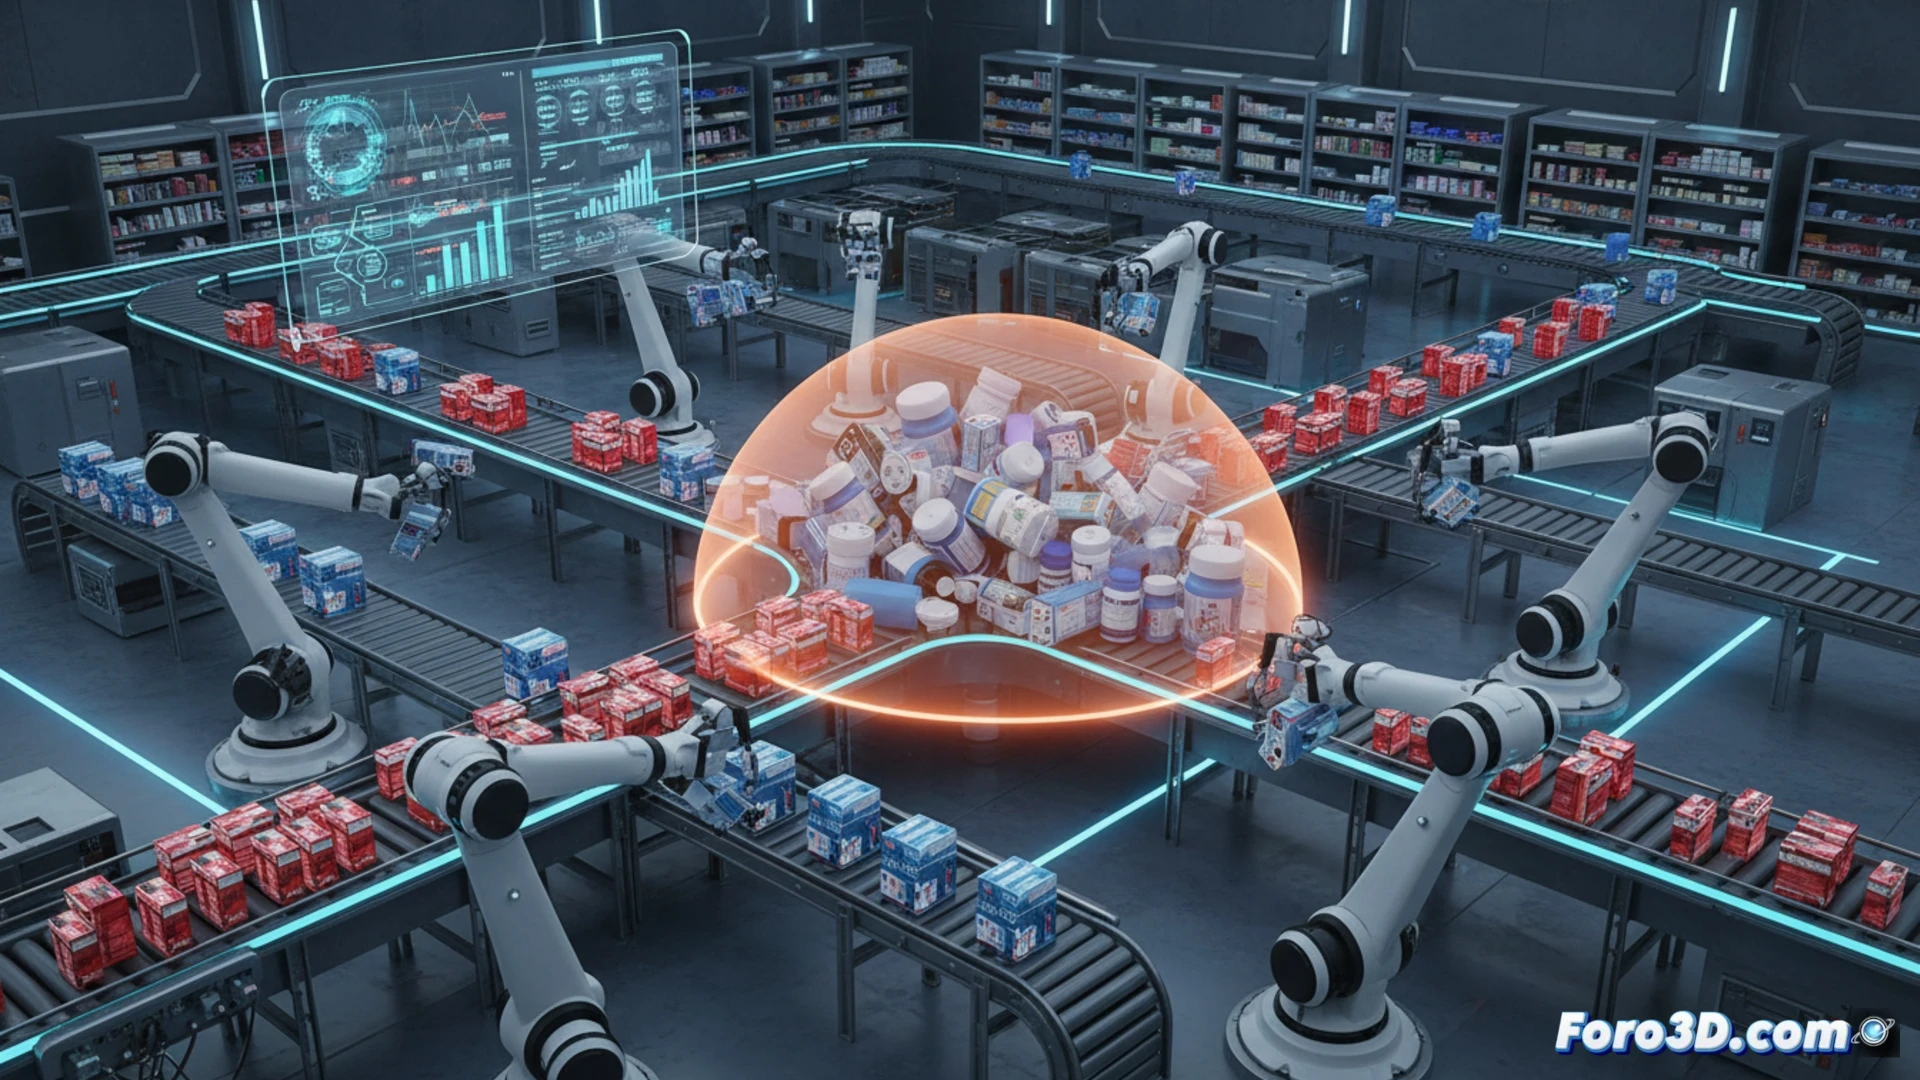
To understand the jam, we must model the product's path in 3D. The process begins at the robotic shelf, where a pneumatic arm extracts the blister pack. This goes onto a variable-speed conveyor belt that directs it towards a sorting hopper. The critical point is usually located at the intersection between the belt and the hopper, where the geometry of the packaging or dust accumulation generates excessive friction. Using discrete element method (DEM) simulation, we can visualize the accumulation of units and predict the exact moment of flow collapse.
Predictive redesign to avoid stoppages 🔧
The solution is not just to clean the sensor, but to redesign the bottleneck. By simulating in 3D the hopper's inclination and the belt surface texture, we found that a 35-degree angle with a non-stick coating reduces jams by 80 percent. This approach, based on the pharmacy's digital twin, allows for predictive maintenance and adjustment of the robotic arm parameters before an actual disruption occurs in the supply chain.
How could 3D simulation of jams in robotic pharmacies predict and resolve bottlenecks in high-inventory-turnover industrial logistics?
(PS: simulating an industrial plant is like playing The Sims, but without pools to remove the ladder)