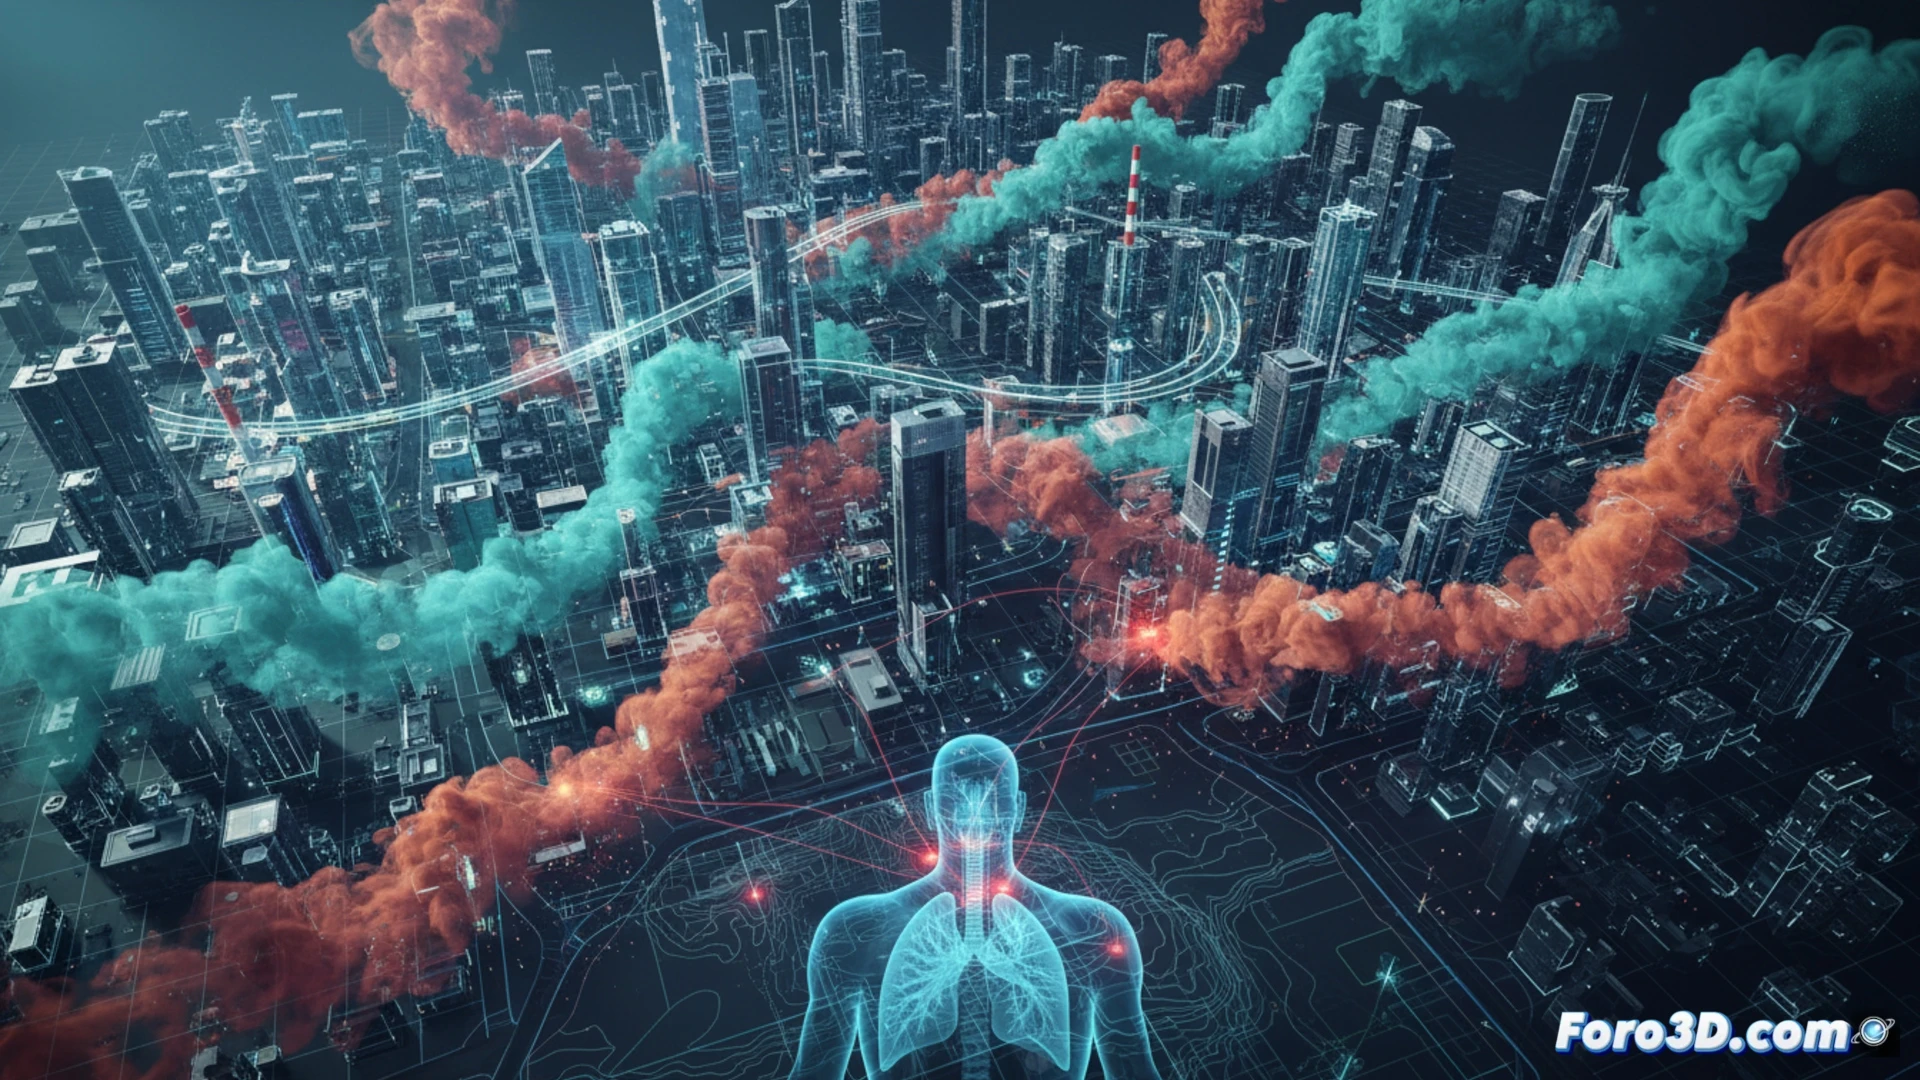
Three-dimensional visualization of fine particulate matter (PM2.5) and nitrogen dioxide (NO2) dispersion is transforming environmental epidemiology. By integrating data from satellites like Sentinel-5P with urban sensor networks and high-resolution meteorological models, researchers can generate dynamic point clouds that show how pollution moves through airspace. This technique makes it possible to identify wind corridors that concentrate toxins and predict exposure hotspots before respiratory symptoms manifest in the population.
Integration of satellite data, monitoring stations, and CFD in a 3D environment 🌍
The technical process begins with the fusion of satellite reflectance images and trace gas columns, which are calibrated with hourly readings from ground stations. This data is fed into computational fluid dynamics (CFD) simulations that model urban turbulence, considering building height and terrain roughness. The result is a 3D volume of concentrations rendered in real-time, allowing cross-sections at different altitudes (e.g., at pedestrian level or on rooftops). Cities like London and Mexico City already use these digital twins to alert the population about high-risk areas for asthma and COPD, visualizing the hourly evolution of pollution in volumetric thermal maps.
Beyond the data: the map as a health decision-making tool 🏥
The real utility of this mapping does not end with visual representation. Early warning systems based on 3D models allow epidemiologists to correlate pollution spikes with hospital admissions for cardiorespiratory issues, adjusting outbreak predictions. Additionally, urban planners can simulate the impact of new green spaces or tree barriers on pollutant dispersion. By democratizing access to these interactive visualizations, local governments transform an abstract problem into a tangible reality, facilitating risk communication and the implementation of more effective and localized public health policies.
How can 3D modeling of pollutant dispersion improve the accuracy of visual epidemiological studies to predict respiratory disease outbreaks in urban areas?
(PS: visualizing obesity in 3D is easy; the hard part is making it not look like a map of solar system planets)