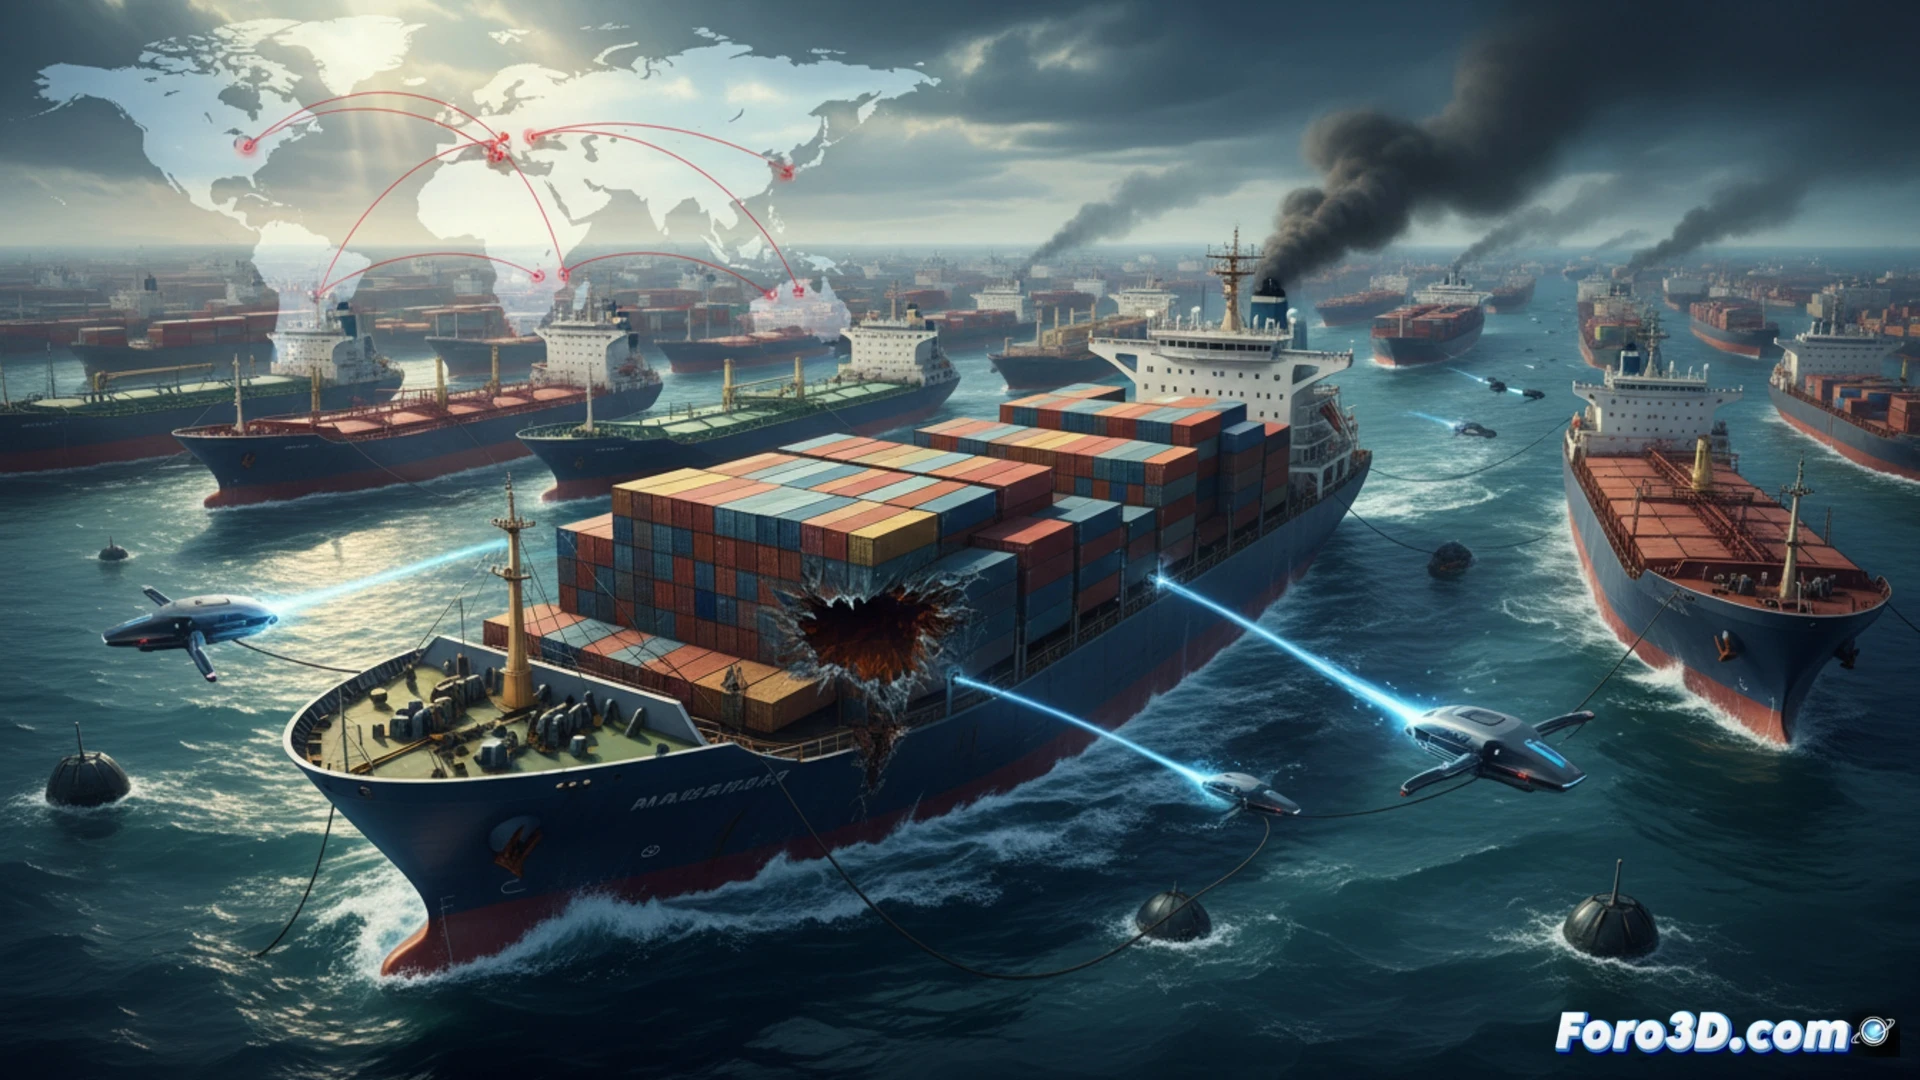
Geopolitics has returned to the sea with a rawness that many analysts underestimated. Naval interference, whether through strategic blockades, sabotage of port infrastructure, or attacks on merchant vessels, has become the most effective mechanism for destabilizing the global economy without the need for a declared war. At Foro3D, we analyze how these incidents are not isolated events, but patterns that reshape the global logistics map.
3D Modeling of Chokepoints and Geopolitical Heat Maps 🌍
We have developed an interactive 3D visualization that maps the three critical bottlenecks: the Strait of Hormuz (flow of 20% of global oil), the Suez Canal (key link for Asia-Europe trade), and the South China Sea (transit of 40% of maritime cargo). Our simulation allows applying naval interference variables, such as activating virtual mines or intercepting a container ship. The result is a dynamic heat map showing the spread of risk: a 72-hour blockade in Suez can delay the delivery of Taiwanese semiconductors to European factories by up to three weeks, raising the logistics cost by 15% for each day of diversion around the Cape of Good Hope.
The Efficiency Paradox: Optimized Routes That Are Perfect Targets ⚓
The maritime industry optimized its routes for speed and fuel savings, creating a hyper-concentrated network. But that same efficiency turns each node into a single point of failure. Our route diversion models indicate that, in the event of naval interference in Hormuz, the massive rerouting towards the Gulf of Aden or the Mediterranean requires 30% more fuel and exposes ships to insurance premiums that quadruple. The lesson is clear: supply chain resilience depends not only on warehouses, but on the ability to predict and visualize in 3D where and how the next act of naval interference can break the flow of food, energy, and technology.
How can logistics and manufacturing companies integrate naval interference as an explicit and measurable risk into their supply chain models, considering that this geopolitical factor has been systematically underestimated in traditional contingency plans
(PS: visualizing the global supply chain is like following a trail of breadcrumbs... in 3D)