Deflagration due to an obstructed valve is a critical event in process plants. Pressure buildup in a pipe section, caused by a solid blockage or mechanical closure, can exceed the material's resistance. This article reconstructs the failure sequence in 3D, from initial overpressure to catastrophic rupture. The goal is to visualize the dynamics of the blast wave and analyze structural vulnerability points to propose improvements in industrial safety protocols.
3D Modeling of the Blast Wave and Rupture Point 💥
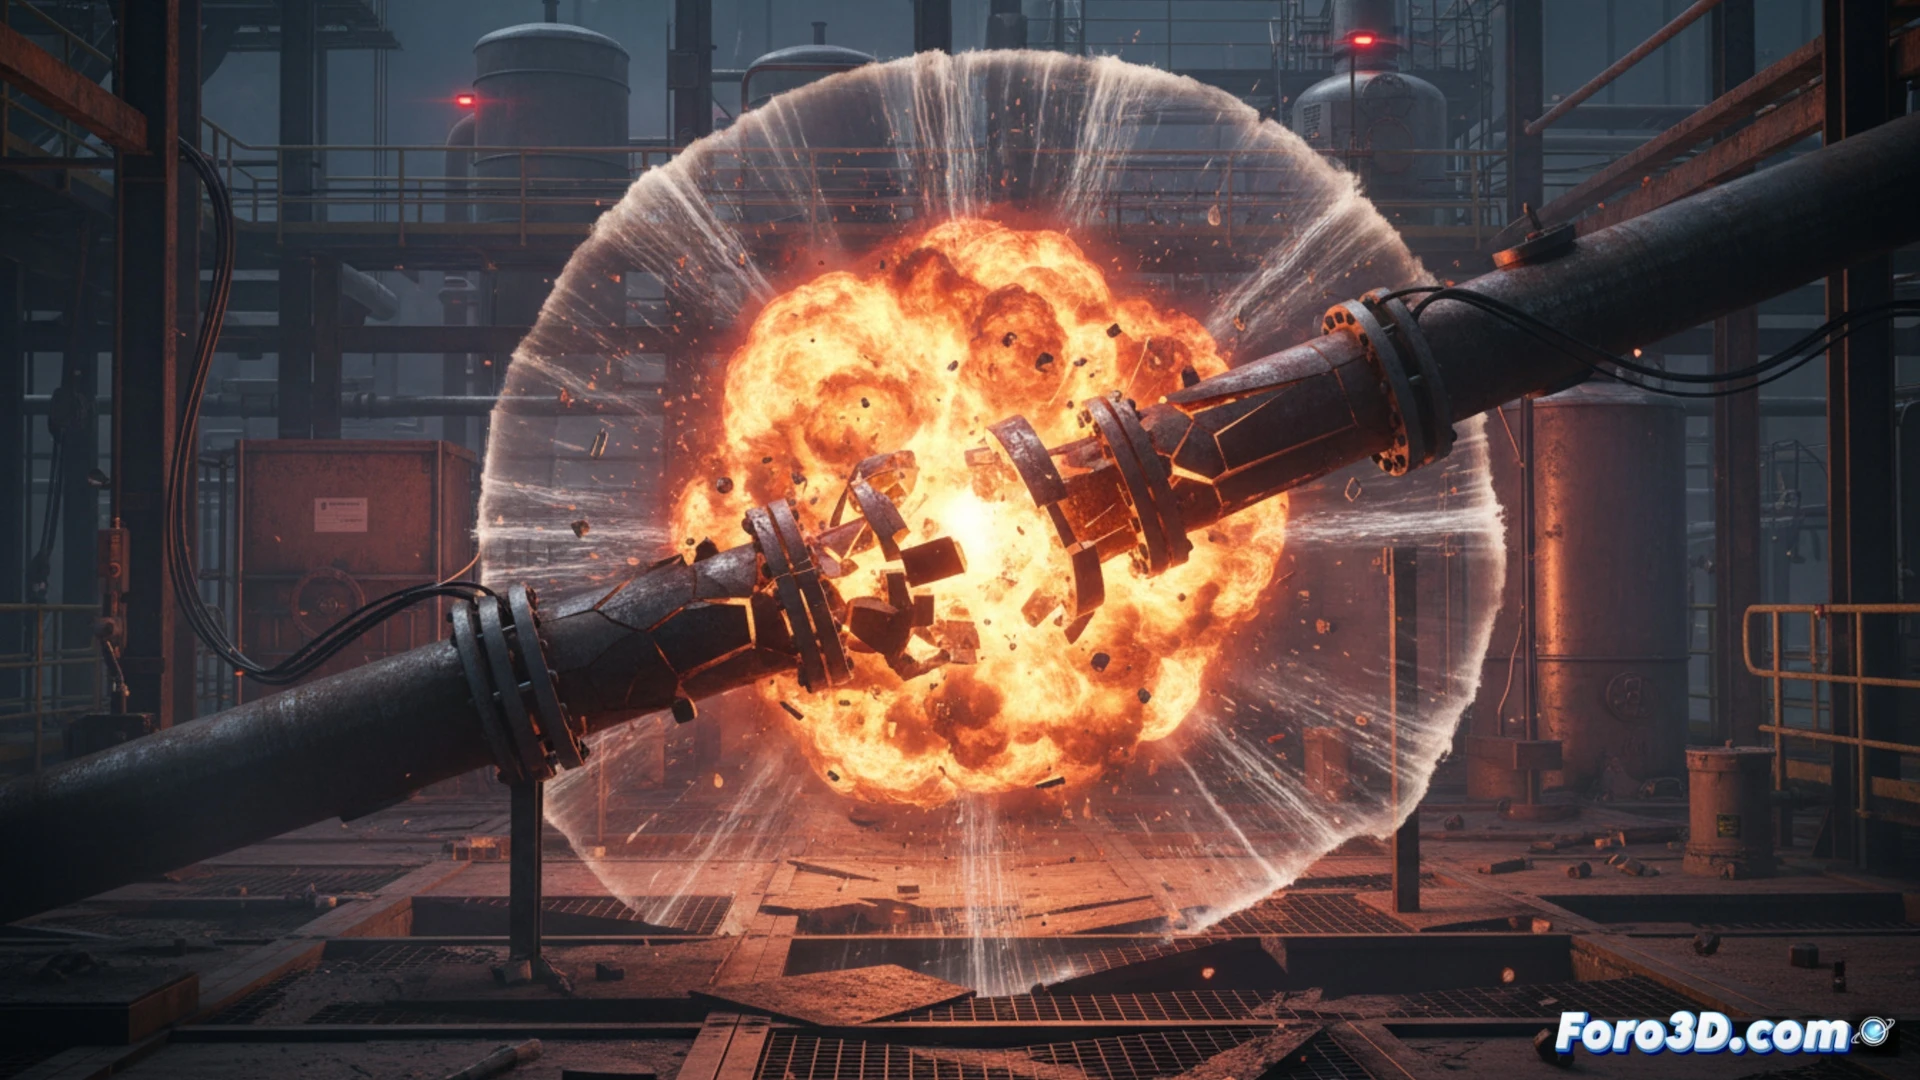
The 3D simulation begins with the representation of a gate valve obstructed by deposits. The model calculates the upstream pressure gradient using compressible fluid data. Upon reaching the steel's elastic limit, a microcrack forms and grows exponentially. The reconstruction visualizes the sudden energy release: the shock wave propagates in a 120-degree cone, impacting adjacent beams and tanks. Finite element analysis reveals that expansion joints are the weakest link, concentrating mechanical stress before total deflagration.
Lessons for Relief System Design 🔧
The 3D visualization of this catastrophe demonstrates that a redundant safety valve, located upstream of the obstruction, could have dissipated the critical pressure. Additionally, the model shows that pipe supports failed in a chain reaction, multiplying the damage radius. Implementing pressure sensors with millisecond response times and materials with higher fracture toughness are viable improvements. This study reinforces the need for periodic audits and blockage scenario simulations to prevent future deflagrations.
How would you model in 3D the failure sequence of an obstructed valve to simulate deflagration and validate explosion hypotheses in a process plant?
(PS: Simulating catastrophes is fun until the computer melts down and you are the catastrophe.)