The collision between two heavy vehicles at a critical transport node has created a bottleneck that paralyzes the flow of goods. This article analyzes the incident from a three-dimensional perspective, modeling the accident scene to visualize the exact disruption. By simulating traffic prior to the impact, we identify structural failure points on the route and evaluate the domino effect on inventories, offering key data for the optimization of industrial logistics.
3D Modeling of the Incident and Analysis of Alternative Routes 🚛
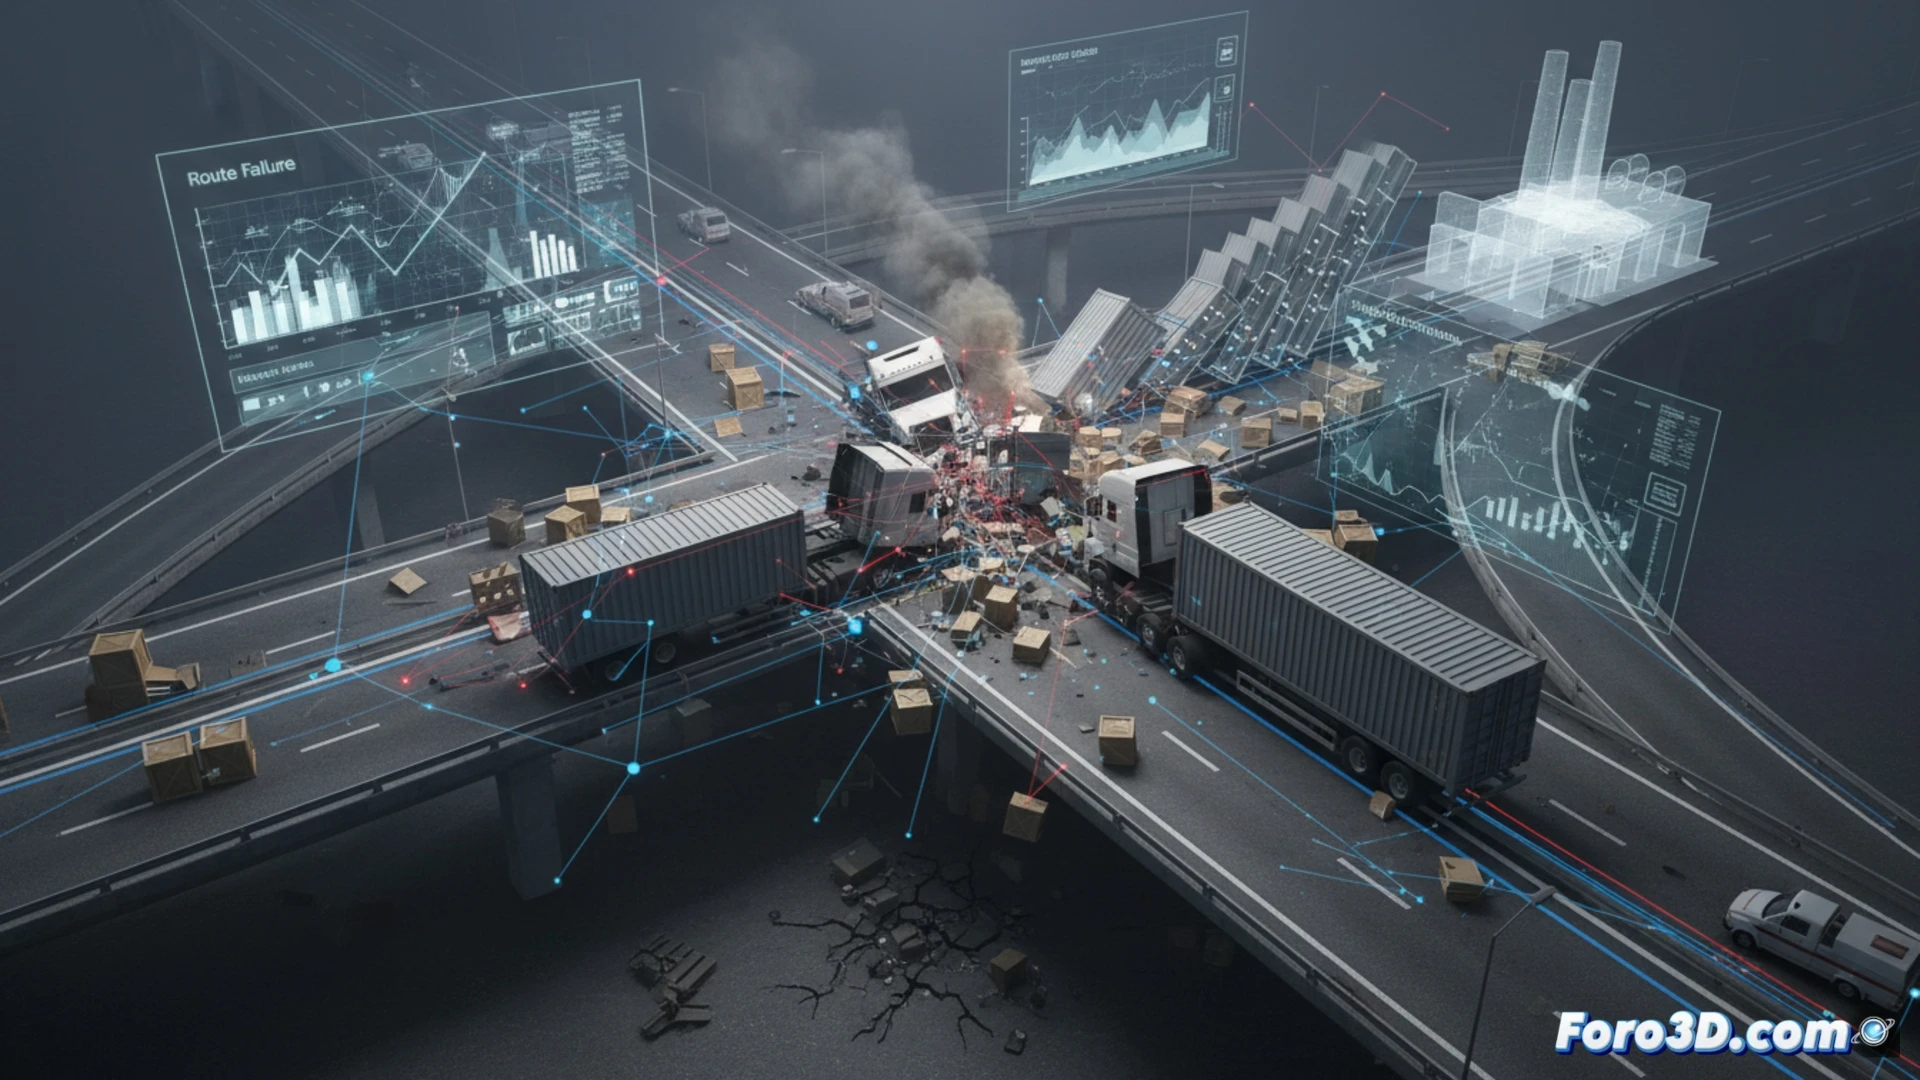
The digital reconstruction of the collision point allows breaking down the geometry of the impact: the blocked turning radii, the deformation of the safety barrier, and the occupation of the acceleration lane. By overlaying this model onto the logistics flow map, the loss of load capacity is quantified in real time. Simulations show that the proposed alternative routes, although viable in 2D, have slopes and clearances incompatible with standard vehicles, generating additional delays of 40% in distribution. This visual analysis is essential for redesigning emergency diversion protocols.
3D Lessons to Prevent the Next Bottleneck 🔍
The visualization of the incident reveals that the collision was not an isolated accident, but the result of chronic congestion undetected by traditional monitoring systems. By integrating predictive 3D models with live traffic data, companies can anticipate these friction points and redesign critical intersections before a disaster occurs. The technology allows shifting from costly reaction to prevention based on spatial data, protecting the continuous flow of the supply chain.
How can the 3D reconstruction of the logistics collision optimize the simulation of alternative routes in the supply chain to minimize the impact of the bottleneck in real time
(PS: visualizing logistics flows is like watching ants... but with less order and more budget)