Weather Data Visualization with AEMET Using GIMP and Wacom Intuos Pro Tablet
The State Meteorological Agency reports a stable weather situation for Spain, with no warnings for high temperatures, but with significant regional thermal variations. Using GIMP and the Wacom Intuos Pro, we will create a clear visualization that effectively communicates this data to the public. 🌡️
Initial Project Setup in GIMP
We begin by preparing the workspace in GIMP to optimize the workflow with the Wacom Intuos Pro tablet, configuring brushes and tools for maximum precision in drawing borders and geographic elements.
GIMP Environment Preparation:- Open new 1920x1080 pixel document with 300 ppi resolution for high quality
- Configure pressure-sensitive Wacom brushes for variable strokes
- Create organized layers: base, borders, temperatures, legend, and text
The pressure sensitivity of the Wacom Intuos Pro allows for creating more natural temperature gradients and smooth transitions between climate zones
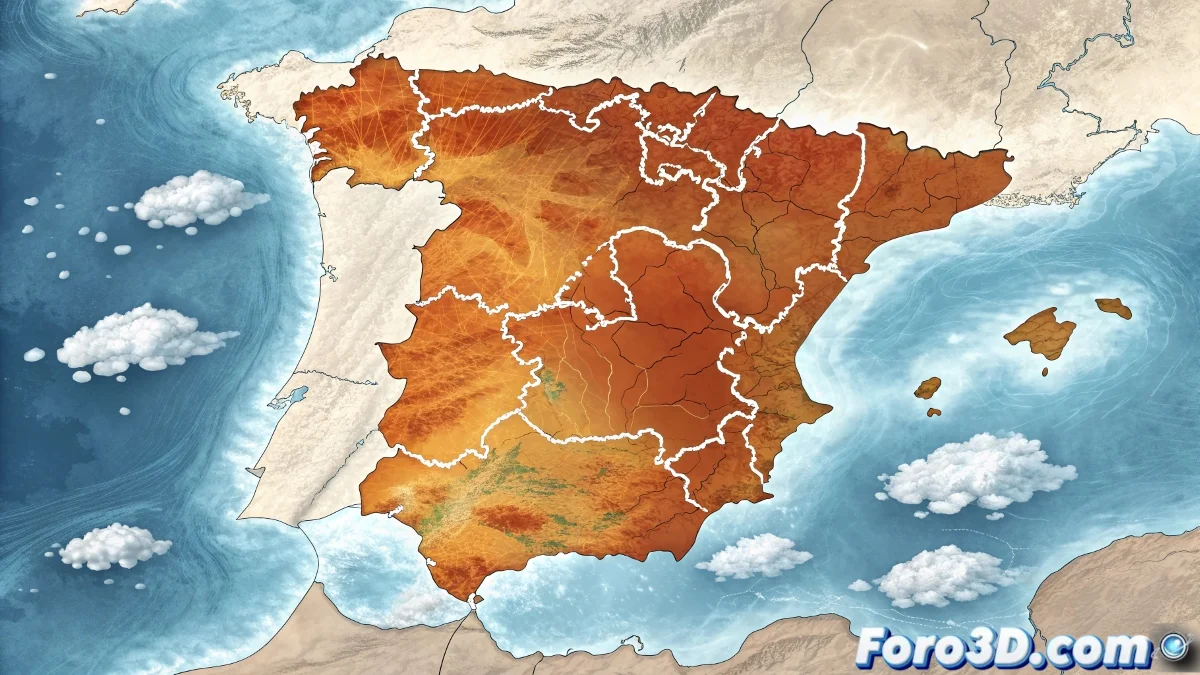
Creation of Base Map and Territorial Boundaries
Using the tablet's precision, we outline Spanish geography with special attention to the areas mentioned in the report: Cantabrian region, Galician coasts, and southeastern peninsular area.
Base Map Development:- Draw Spain's outline with Path tool and paint with pressure-sensitive brush
- Delimit autonomous communities with fine strokes using brush stabilization
- Apply soft shading for orographic relief with airbrush and tablet
Application of Thermal Data with Color Coding
We implement an intuitive color system that visually shows the temperature variations reported by AEMET, using the tablet's blending capabilities for smooth transitions.
Temperature Visualization:- Create maximums layer with soft orange tones for increase in Cantabrian and Galicia
- Apply minimums layer with blues for decrease in southeast using low-opacity brushes
- Highlight absence of warnings with green border across the national territory
Final Elements and Professional Labeling
We complete the weather visualization by adding informative elements that facilitate immediate understanding of the data, leveraging the Wacom's precision for text and fine details.
Professional Finishes:- Add temperature legend with color samples and numerical values
- Include dates and AEMET source with clear, legible typography
- Create geographic orientation marks and map scale
Export and Application of the Work
The final result is a professional weather map that effectively communicates the current situation: general stability with specific regional variations. The combination of GIMP with the Wacom Intuos Pro tablet demonstrates that free software can produce professional-quality visualizations for weather communication. 🗺️