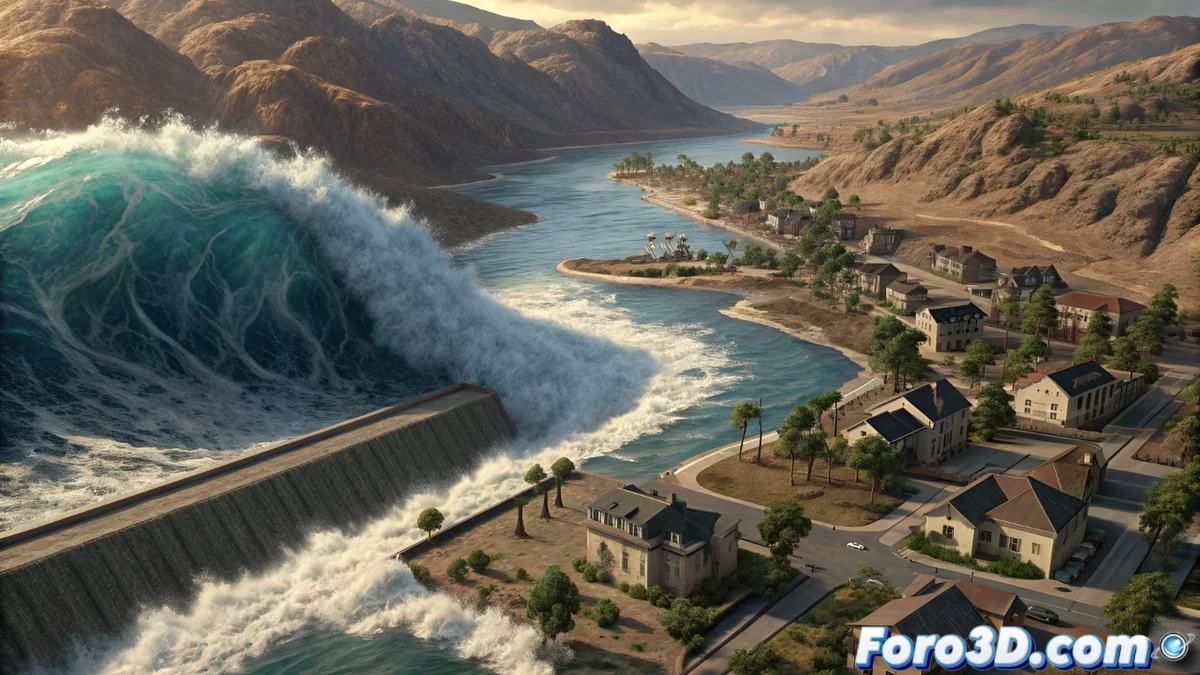
3D Forensic Reconstruction of a Flood Due to Dam Failure
The discipline of forensic engineering has undergone a revolution with the incorporation of three-dimensional visualization and simulation technologies. 🕵️♂️💻 In the face of events such as the failure of a small dam that causes the flooding of a residential area, a rigorous methodology is deployed that fuses geospatial data, physical calculations, and advanced rendering. This digital expertise not only seeks to understand the dynamics of the disaster but also to objectively compare it with what safety regulations would have required, establishing a solid technical opinion.
Phase 1: Precise Terrain Capture and Modeling
The foundation of any reliable investigation is an exact representation of reality. This initial stage focuses on processing all available geographic information from the affected area. Using specialized platforms like QGIS or ArcGIS, experts integrate data from LiDAR scanners, aerial orthophotos, and topographic contour lines. The goal is to generate a high-precision Digital Elevation Model (DEM) that includes the valley, the residential area, and the damaged dam structure. 🔍🗺️ This 3D mesh is not a simple drawing; it is the computational geometry on which the complex equations of water flow will be solved. A discrepancy of a few centimeters in the altimetry can completely skew the subsequent simulation results.
Key data and tools in this phase:- Data sources: LiDAR point clouds, georeferenced orthophotos, official topographic cartography.
- Processing software: QGIS, ArcGIS, Global Mapper for managing and fusing layers of information.
- Final product: A 3D mesh (often in .stl or .obj format) ready to be used in fluid dynamics simulators.
The precision of the terrain model is the foundation on which the credibility of the entire forensic simulation is built.
Phase 2: Computational Simulation of Water Dynamics
With the geometric scenario defined, the core of the analysis proceeds: hydrodynamic simulation. Calculation engines like HEC-RAS (oriented toward hydrology) or OpenFOAM (for a more detailed Computational Fluid Dynamics - CFD approach) come into play. In these environments, the event parameters are meticulously configured: the volume of the retained water sheet, the geometry and instant of the breach in the dam, and the flow properties. The power of this pipeline lies in running two scenarios in parallel. ⚖️💧 The first recreates the actual catastrophic event with all its details. The second, the regulatory scenario, simulates how the water would have behaved with a dam designed and built in accordance with regulations, including safety elements like adequate spillways. The results, which are millions of data points on height, velocity, and pressure in space and time, are exported for the final phase.
Critical simulation parameters:- Initial conditions: Water level in the reservoir, exact geometry of the breach.
- Fluid properties: Viscosity, density (water with sediments may vary).
- Boundary conditions: Terrain roughness (asphalt, grass, soil), soil permeability.
Phase 3: Expert Visualization and Opinion Generation
The final stage transforms cold numerical data into comprehensible and forensically valid visual evidence. Scientific visualization tools like ParaView or Blender (with specialized add-ons) take center stage. With them, flood maps with color codes, animations showing the propagation of the flood wave, and cross-sections revealing water depth in specific streets are generated. 🎬📊 The side-by-side visual comparison between the real scenario and the regulatory one is eloquent and powerful: it demonstrates how an adequate design would have contained, diverted, or slowed the flow, substantially mitigating material and human damages. These 3D visualizations, accompanied by quantitative metrics (flooded area, maximum velocities, arrival times), are integrated into a definitive expert report. This document can be crucial in a judicial or compensation process, objectively and irrefutably demonstrating the causal relationship between the infrastructure failure and the damages caused.
Often, the most revealing—and economically cheapest to generate—simulation is the one showing water flowing in a controlled manner as planned, an alternative scenario that dramatically contrasts with the cost of compensations for the real damages. 💡⚖️