Synfig Studio to Transform Static Data into Dynamic Animations
Data visualization takes on a completely new dimension when using specialized tools like Synfig Studio. This vector animation platform allows converting boring information into captivating presentations that hold the audience's attention and facilitate the understanding of complex concepts. 🎯
Advantages of the Vector Approach in Data Animation
The vector nature of Synfig ensures that your creations maintain impeccable quality on any screen size, from mobile devices to auditorium projections. The integrated bone system greatly simplifies the animation of interconnected elements, allowing the creation of organic and controlled movements without the need to manually redraw each frame. 💫
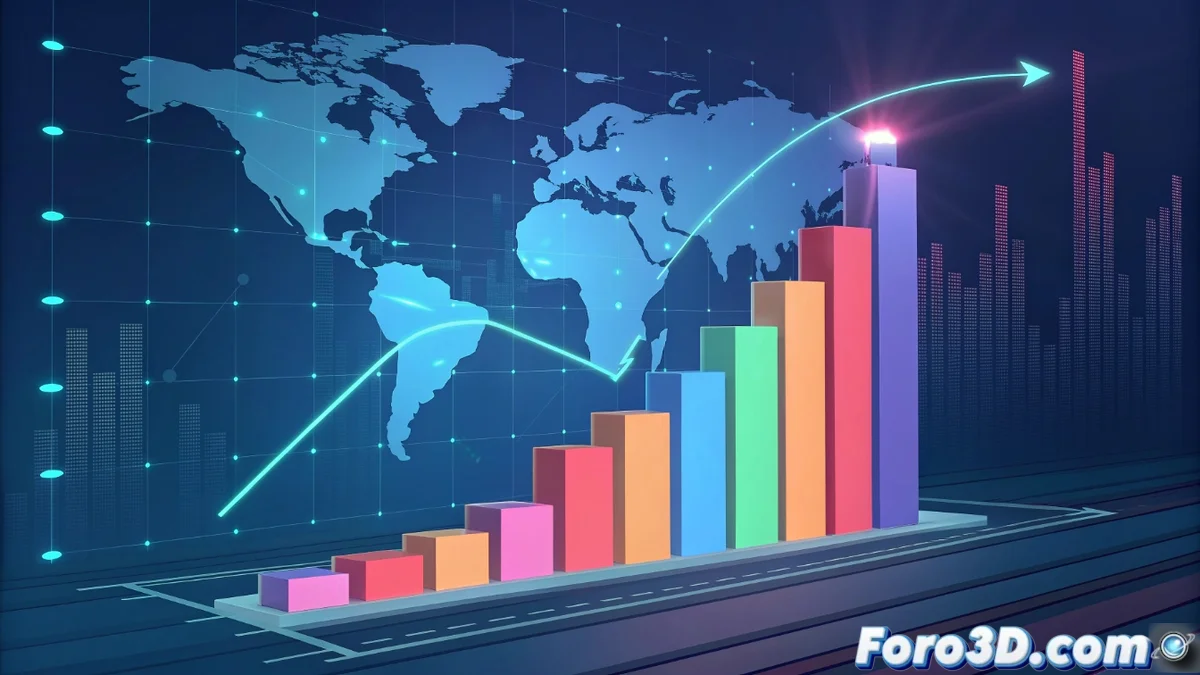
Main applications of the bone system:- Progressive animation of bar graphs that grow according to data values
- Creation of flow diagrams where elements connect automatically
- Controlled movement of data points on interactive maps
Synfig Studio eliminates the need to draw frame by frame, allowing focus on the visual narrative instead of repetitive technical execution.
Implementation in Real Projects
In educational and corporate contexts, Synfig becomes an invaluable tool for transforming static data into memorable visual stories. Imagine being able to show the evolution of regional sales through colored points that move and change size on a map, or create pie charts whose segments separate to emphasize specific proportions. 📊
Examples of successful implementation:- Explanatory materials showing step-by-step processes with smooth animations
- Scatter plots that evolve over time to highlight trends
- Interactive infographics that respond to different data sets
Benefits in the Creative Workflow
The automation of animations through the bone system not only speeds up the creative process but also eliminates the tedious manual work of traditional animation. This allows freely experimenting with different visual approaches without worrying about quality loss or scalability. While your graphs come to life with natural movements, you can focus on the message and aesthetics, knowing that the tool handles the most repetitive technical part. 🚀