Sale of Spotify Wrapped Data and Its Impact on AI and 3D Visualization
The intersection between artificial intelligence and music has generated a peculiar practice: users selling their Spotify Wrapped data to train AI models 🎵. This trend allows algorithms to learn from individual musical preferences and habits, creating more accurate recommendations or even generating new music based on personal tastes. Although Spotify officially disapproves of this practice due to privacy concerns, the phenomenon opens fascinating possibilities for 3D visualization, where artists can represent how musical data transforms into artificial knowledge and immersive visual experiences.
When your embarrassing song list is worth more on the black data market than your dignity.
Project Setup and Abstract Modeling
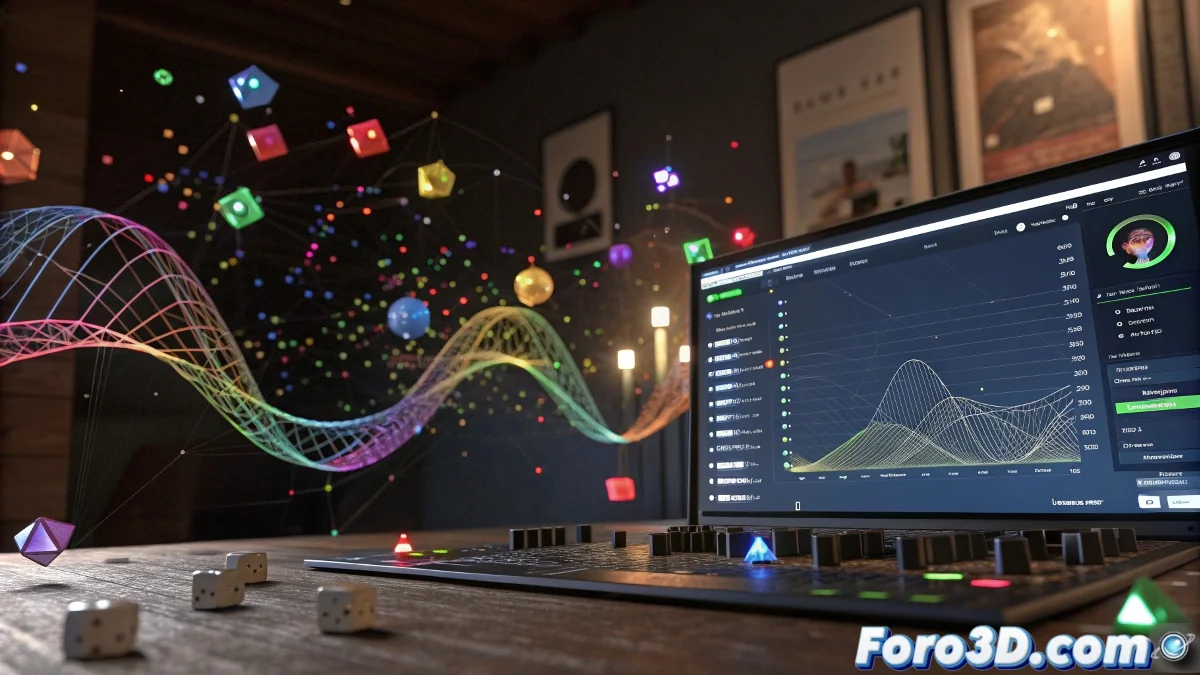
We begin by creating a new project in Blender with metric units and organizing logical collections: Background, Devices, Data, AI, Lights, and Cameras. We model the scene with a base plane scaled to 15 meters and a vertical background that will serve as a canvas for floating elements. Representative devices - smartphones, tablets, and speakers - are created using modified primitives: elongated subdivided cubes for screens, and combinations of cylinders and spheres for audio elements. The key is to keep the shapes recognizable but stylized, optimized for visualizing the data flow rather than photorealism. 📱
Data Flow System and AI Representation
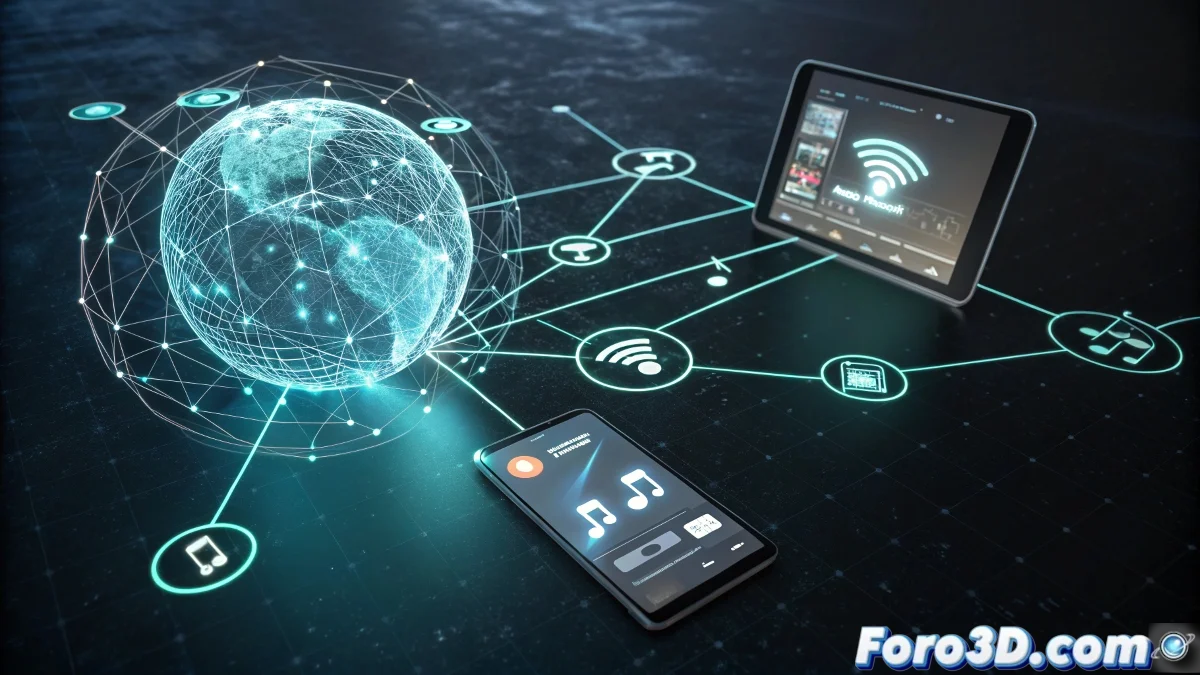
The core of the visualization lies in representing how musical data flows to AI systems. We create a central sphere as the artificial intelligence node, surrounded by small floating cubes that symbolize collected data. We use Bezier curves with bevel objects to connect peripheral devices to the central sphere, creating a visual network of information flow. Floating bar graphs, represented by extruded and vertically scaled cubes, show musical activity metrics, while abstract musical notes (toruses and curved planes) suggest the melodic content being processed.
Emissive Materials and Color Scheme
We apply a technological color scheme with emissive materials that highlight the digital nature of the scene. Devices receive Principled BSDF shaders with metallic at 0.5 and roughness between 0.3-0.5 to simulate technological surfaces. Screens use Emission materials with strength 5-10 to display abstract data visualizations. The AI sphere and data elements employ emissives in blue and cyan tones (strength 3-8), creating an effective contrast with the dark background. This approach is not only visually striking but also clearly communicates the concept of active data and real-time processing.
Volumetric Lighting and Technological Ambiance
We set up a lighting system that reinforces the digital narrative. A key light type Spot with cold temperature (blue) illuminates the AI sphere from above with 500-1000W power. Fill lights type Area with neutral temperature and reduced power (100-300W) reveal details on peripheral devices. We add cyan rim lights behind the main sphere to separate it from the background. A large volumetric cube with Volume Scatter (density 0.01) creates visible light rays that visually connect the elements, reinforcing the idea of data flowing through an ethereal digital space.
Camera Setup and Cycles Rendering
We establish multiple cameras with specific narrative purposes. A main 35mm camera captures the full scene showing the entire data flow, while secondary 50-85mm cameras focus on specific details: connections between devices and AI, individual data visualizations, or close-ups of the central sphere processing information. We render with Cycles for maximum quality in emission and volumetric effects, setting 512-1000 samples with OptiX/OIDN denoise and 4K resolution for the final output.
Post-Processing for Digital Aesthetic
In Blender's Compositor, we apply effects that emphasize the technological character: Glare type Fog Glow to create halos around emissive elements, Color Balance to adjust cold tones in AI areas and warm tones on devices, elliptical mask vignette to direct attention, and subtle Film Grain to add digital texture. We export in EXR to preserve the full dynamic range, resulting in a visualization that not only documents the phenomenon of musical data sales but transforms it into a compelling visual experience.
What's curious is that, while music can inspire incredible virtual 3D worlds thanks to AI, some users simply sell their Spotify habits as if they were rare trading cards. In the end, AI ends up knowing you better than you know yourself, and it could probably predict your next guilty pleasure before you do... but at least our 3D visualizations will always give you credit for your bad musical taste. 😉