Geomagic Control X Compares Physical Parts with CAD Models
In the manufacturing field, verifying that a produced part matches its digital design is crucial. The program Geomagic Control X specializes in this task, aligning the scanned physical reality with the CAD model theory to reveal any discrepancies in a visual and immediate way 🔍.
Basis of Digital-Physical Comparison
The core of the process lies in overlaying two datasets. On one hand, there is the three-dimensional point cloud, obtained by scanning the physical object with metrology equipment. On the other, the theoretical CAD model that serves as the perfect reference. The software calculates the distance from each scanned point to the ideal CAD surface, transforming numerical values into an intuitive graphical representation.
Key Workflow:- Import Data: The CAD file and the 3D scan point cloud are loaded.
- Automatic Alignment: The software positions both datasets in the same coordinate space for precise comparison.
- Calculate Deviations: The distance between each real point and the theoretical surface of the model is measured.
A clear color map can avoid costly rework and ensure the part functions as designed.
Interpreting the Visual Language of Deviations
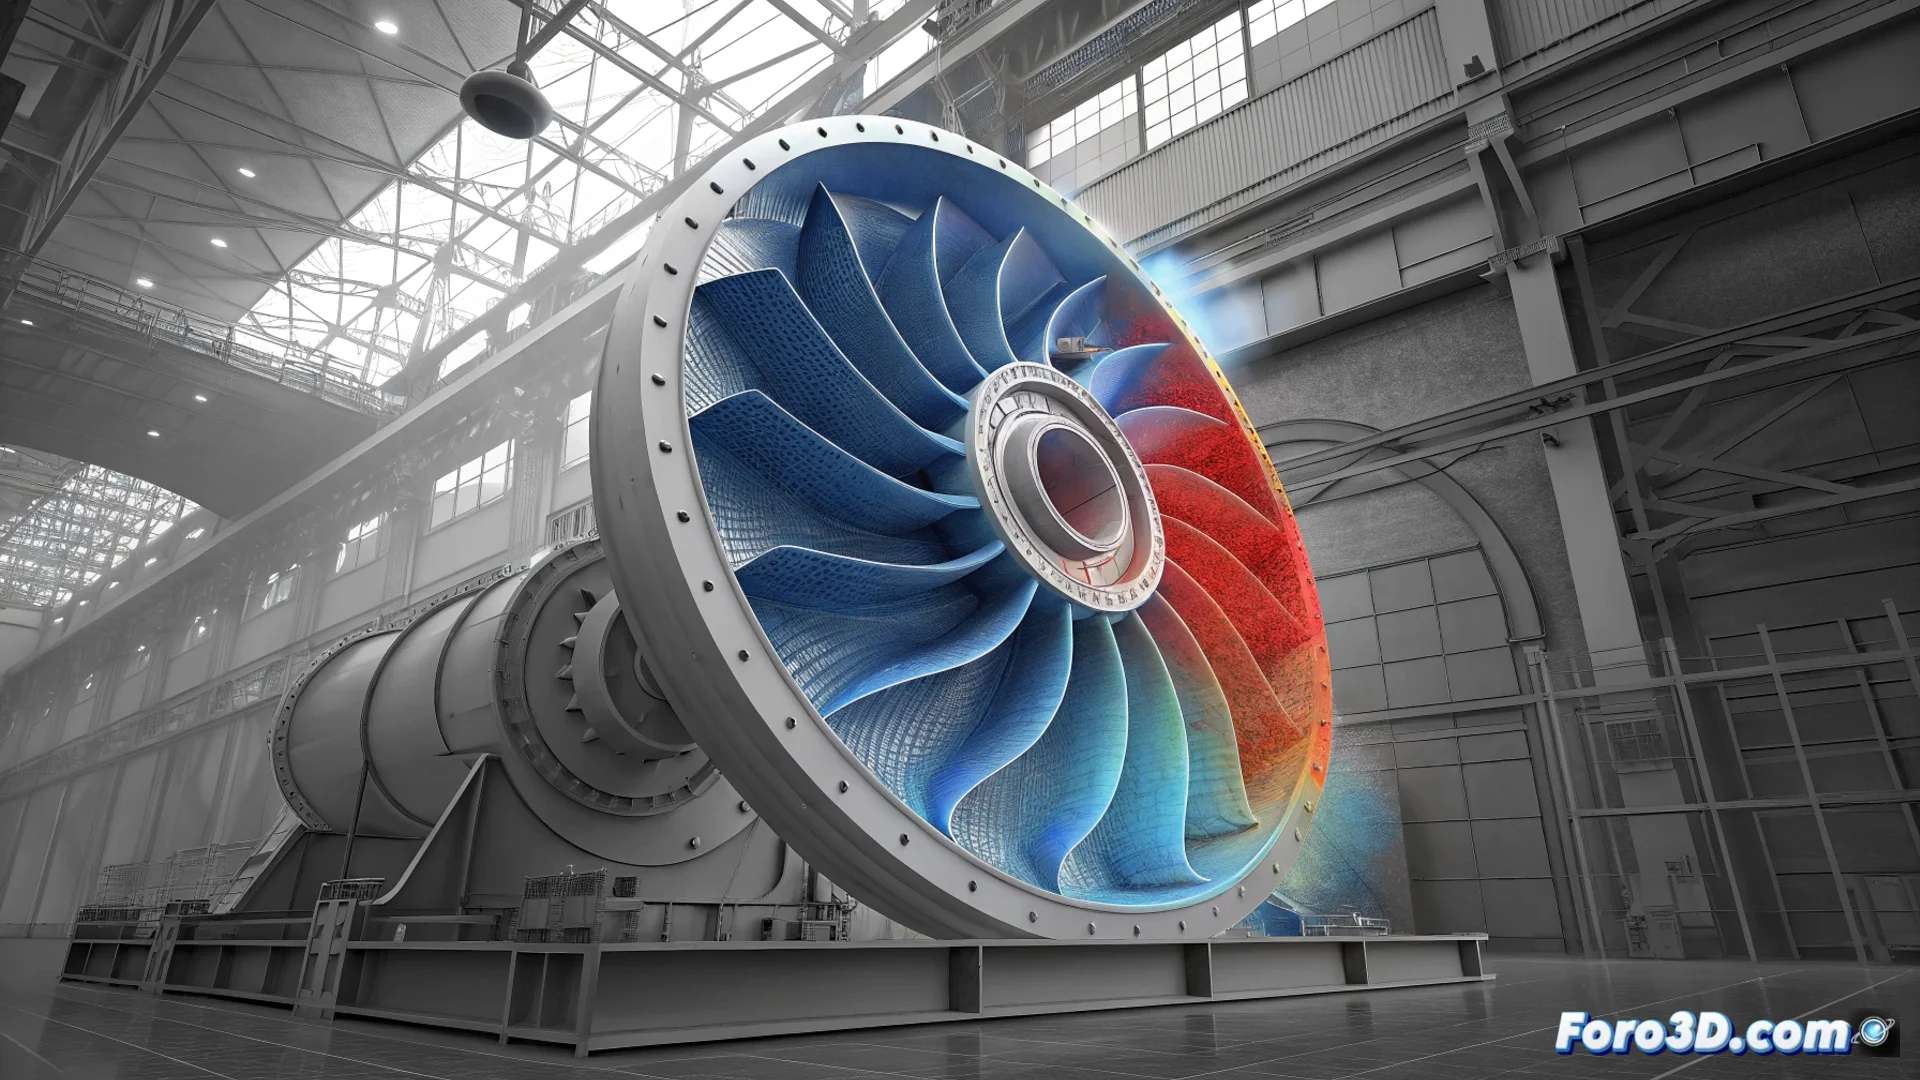
The results are not just numbers. The software generates a color map that overlays the geometry, creating an instant visual report. This chromatic palette assigns a specific meaning to each deviation range, allowing problems to be identified at a glance.
Typical Color Code:- 🟢 Green: Indicates the area is within the allowed tolerance limits.
- 🔴 Red: Signals excess material, with a positive deviation above the upper limit.
- 🔵 Blue: Shows missing material, with a negative deviation below the lower limit.
From Data to Action: Generating Reports
Visualization is just the first step. Geomagic Control X allows documenting findings comprehensively. Detailed reports can be created that include statistical tables, distribution graphs, and section views. These documents are vital for communicating results to the production team, making corrective decisions, and maintaining a quality record. When the map resembles an abstract painting more than the original plan, it's a clear signal to review the manufacturing process 🛠️.