Transforming Optometry Learning into an Interactive 3D Journey 🌳
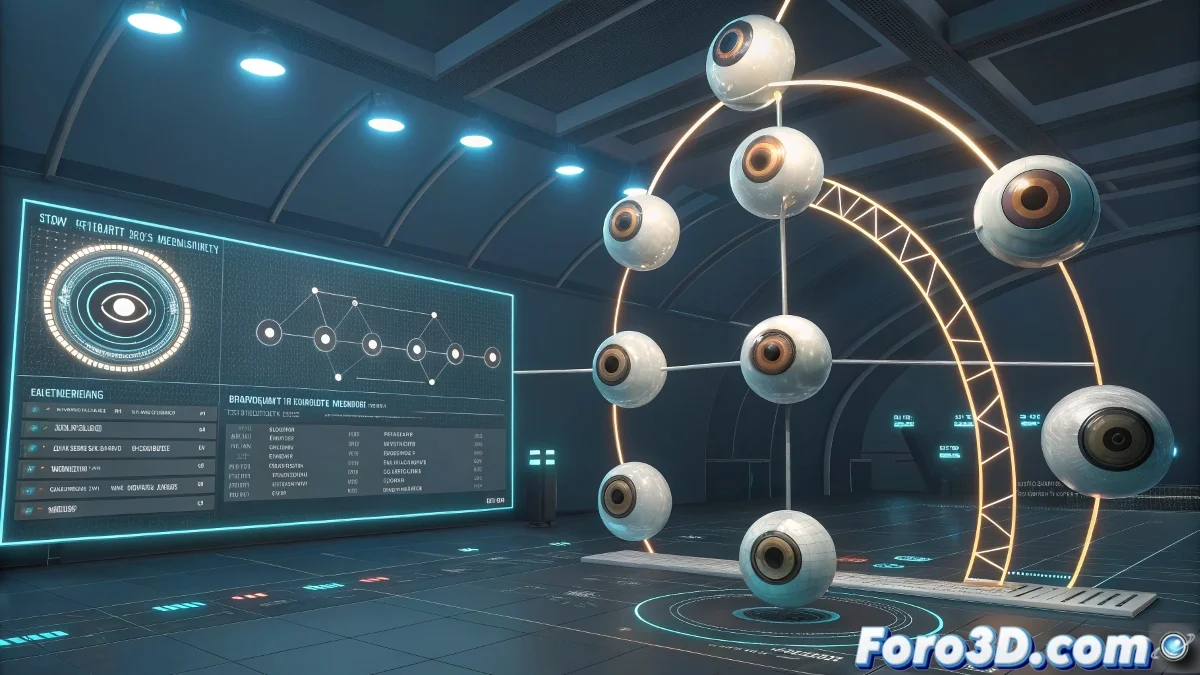
Imagine studying ocular pathologies by navigating through a three-dimensional knowledge tree, where each node is a medical condition and its connections show clinical relationships. This is not science fiction: with tools like Blender and Three.js, you can create an educational system that makes textbooks seem like they're from the last century.
From Blender to the Browser: The Creative Pipeline
To build your interactive medical dendrogram:
- Modeling in Blender: Design nodes (spheres, icons) and organic connections with bezier curves.
- Optimization: Reduce geometry and use LODs (Levels of Detail) so it doesn't crash browsers.
- Export: Save as GLTF/GLB to preserve hierarchies and animations.
- Web Programming: Implement interactivity with Three.js (clicks, tooltips, zoom).
A well-optimized dendrogram is like a healthy eye: everything flows without apparent effort.
Technical Options Based on Your Budget
| Approach | Time | Cost | Result |
|---|---|---|---|
| Self-taught | 2-3 months | €0 (only time) | Basic functional version |
| Freelance project | 4-6 weeks | €1,000-3,000 | Complete system with design |
| Professional team | 2-4 weeks | €5,000+ | Premium solution with backend |
3 Mistakes That Will Turn Your Project into a Red Eye
- Not optimizing models: More than 50k polygons will make the experience slower than a dilated pupil.
- Forgetting usability: Navigation must be as intuitive as a visual acuity test.
- Information overload: Showing all data at once is like an undilated fundus exam: confusing.
With these tips, your dendrogram will be as clear as 20/20 vision... though if it fails, you can always say it's an "experiment on visual perception" 👁️🗨️. Let's get developing!