Creating Spectrograms with Geometry Nodes in Blender
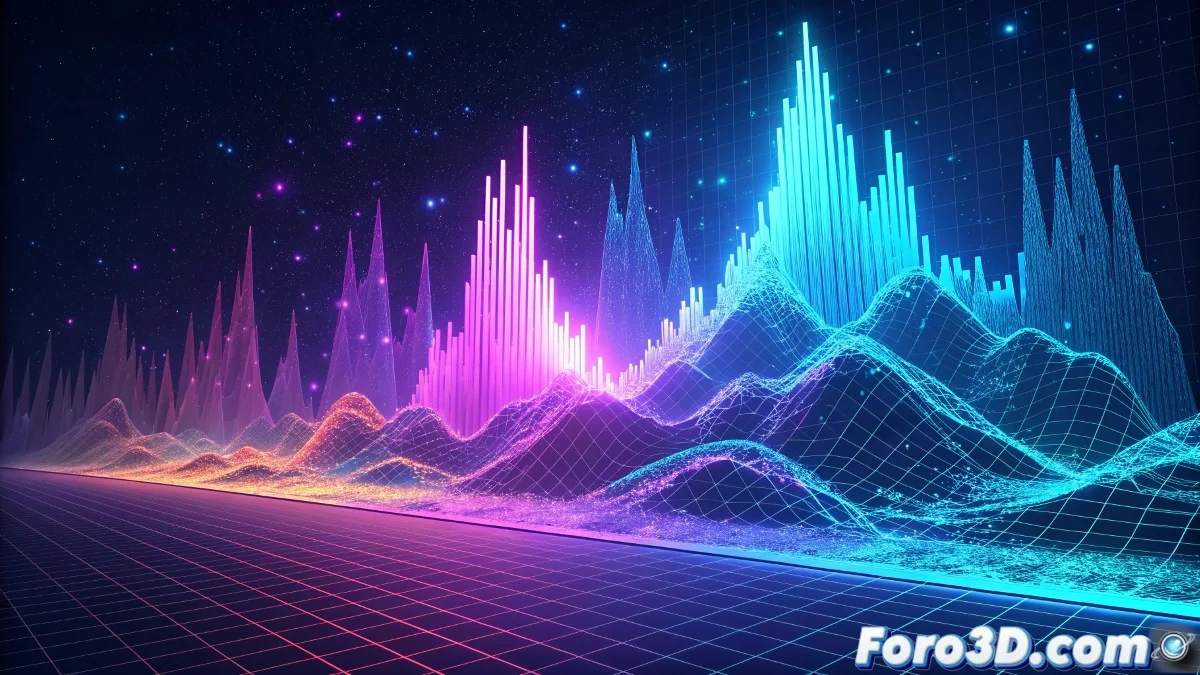
Spectrograms are visual representations that transform sound into graphics, showing the evolution of frequencies over time. With Geometry Nodes in Blender, we can create completely procedural three-dimensional spectrograms that are not only visually striking but also animatable and customizable. 🎵
Base Setup of the Node System
The heart of our procedural spectrogram begins with a base gridGeometry Nodes to instance geometry at each point of the grid, where the height of each instance will be controlled by the audio data we want to represent visually.
Fundamental Nodes for the Structure:- Mesh Grid as the base for point distribution
- Instance on Points to generate the spectrogram bars
- Value Node or Attribute to control the heights
- Set Material to assign colors based on frequency
"Geometry Nodes turns Blender into a powerful data visualization tool, where sound becomes tangible"
Mapping Audio to Geometric Attributes
The magic of the spectrogram lies in how we convert abstract data into visible geometric properties. We use custom attributes to store intensity values per frequency, then map these values to the Z scale of our instances and to their color values using color ramps that represent different frequency ranges.
Advanced Visualization Techniques:- Use of ColorRamp to represent different frequencies with specific colors
- Temporal animation with time nodes to simulate audio progression
- Manipulation of grid density for higher or lower frequency resolution
Creative Applications and Export
Once our spectrogram system is configured, the possibilities are enormously versatile. We can create musical visualizations for videos, scientific audio analysis, or even integrate these graphics into animated projects and video games. The procedural nature of Geometry Nodes allows adjusting all parameters in real time until achieving the perfect result for each specific application. 🌈