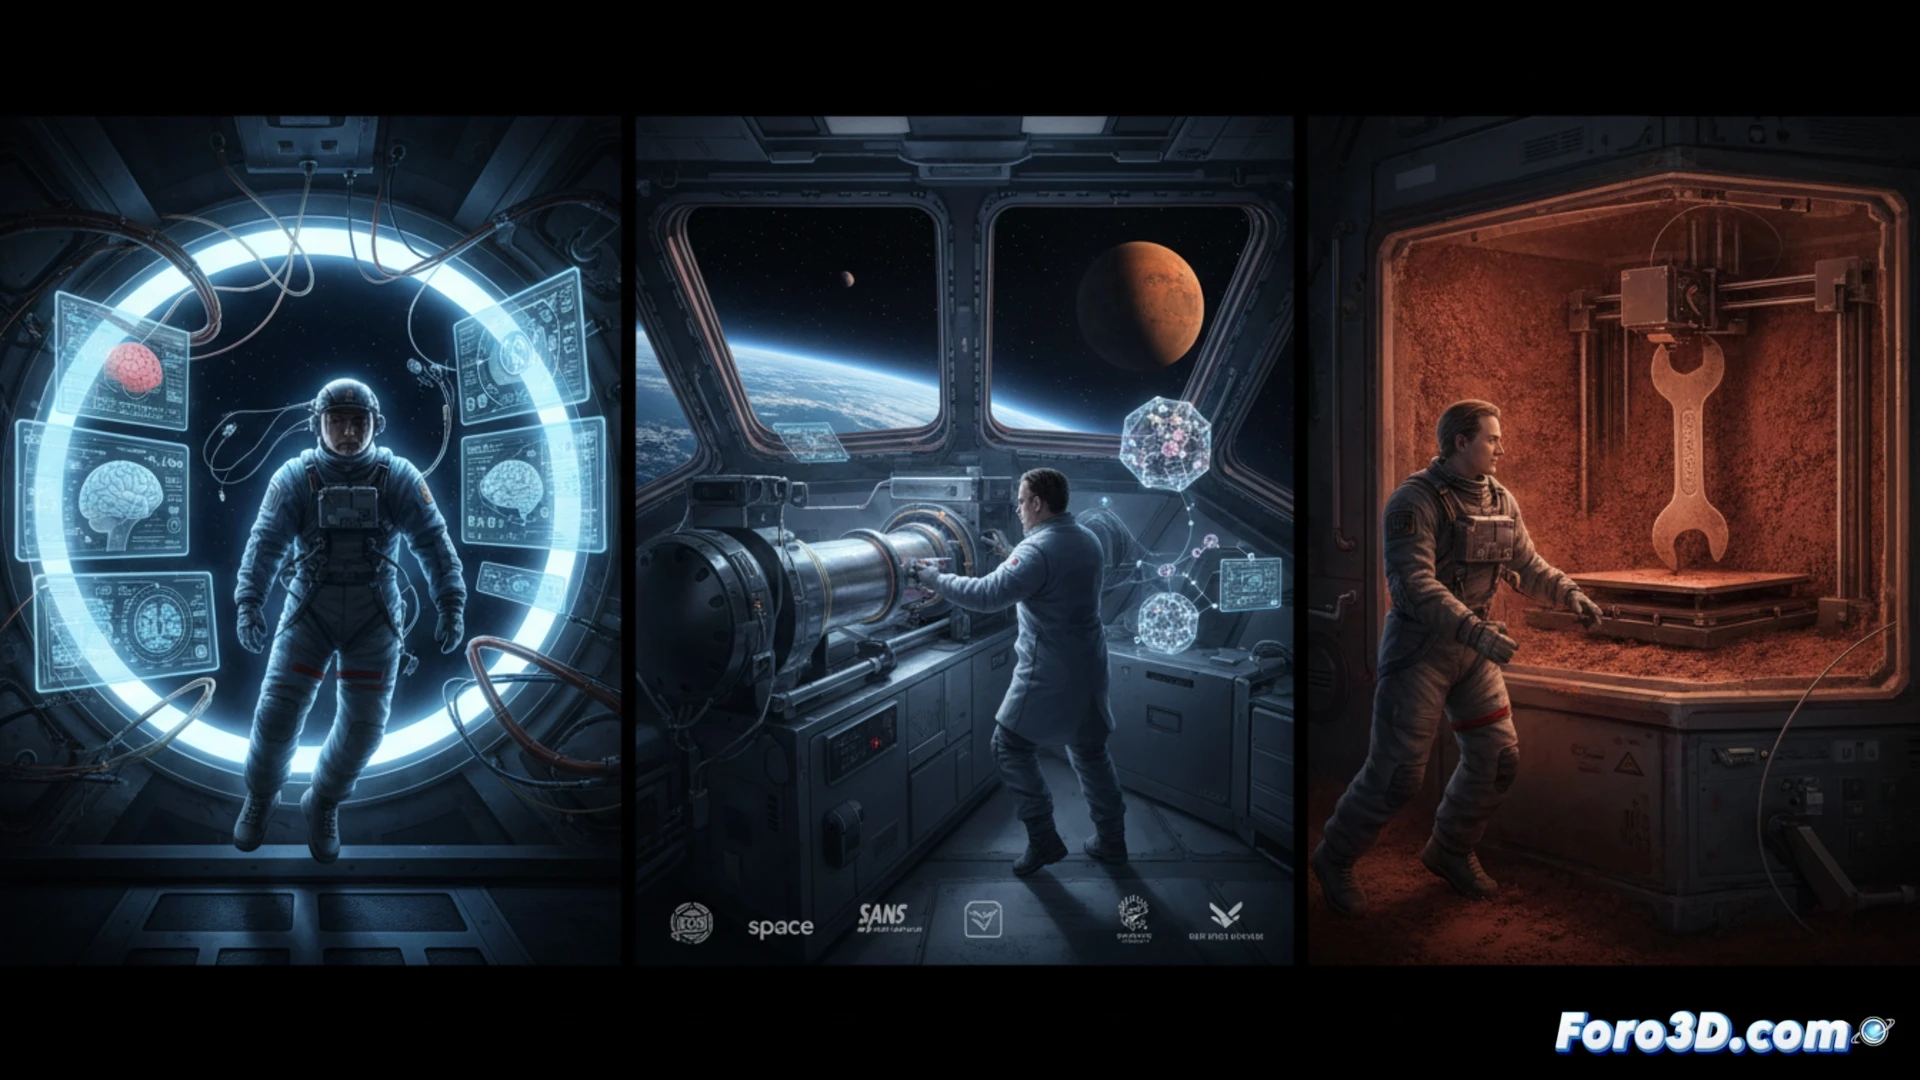
Expedition 74 to the International Space Station conducted pioneering experiments in neuroscience, materials science, and extraterrestrial manufacturing. Beyond data collection, the challenge lies in interpreting them. This is where 3D scientific visualization becomes indispensable, transforming abstract measurements into interactive models that reveal the impact of microgravity on the brain, the structure of nano-materials, and the viability of printing with Martian regolith.
From Raw Data to 3D Models: Tools for Interpretation 🛠️
Each experiment generates complex data streams. MRI images from the brain study require 3D reconstruction to map changes in tissue volume and fluid flow. SANS instrument scattering data is translated into visualizations of the internal nano-structure of materials. And for 3D printing with regolith, computational simulation is key, modeling the powder flow and thermomechanics of the final piece before any physical shipment to Mars. These visualizations are the bridge between the experiment and the conclusion.
Simulation and Outreach: The Dual Impact of Visualization 📢
3D visualization not only accelerates research for scientists and space startups, but also democratizes its understanding. An interactive model of the brain in microgravity or an animation of a tool being printed with Martian dust are powerful communication tools. They turn technical findings into accessible visual narratives, inspiring the next generation and justifying investment in ongoing space exploration.
How can the complex crystal growth patterns in microgravity obtained during Expedition 74 be visually represented to compare them with their terrestrial counterparts?
(P.S.: at Foro3D we know that even manta rays have better social bonds than our polygons)