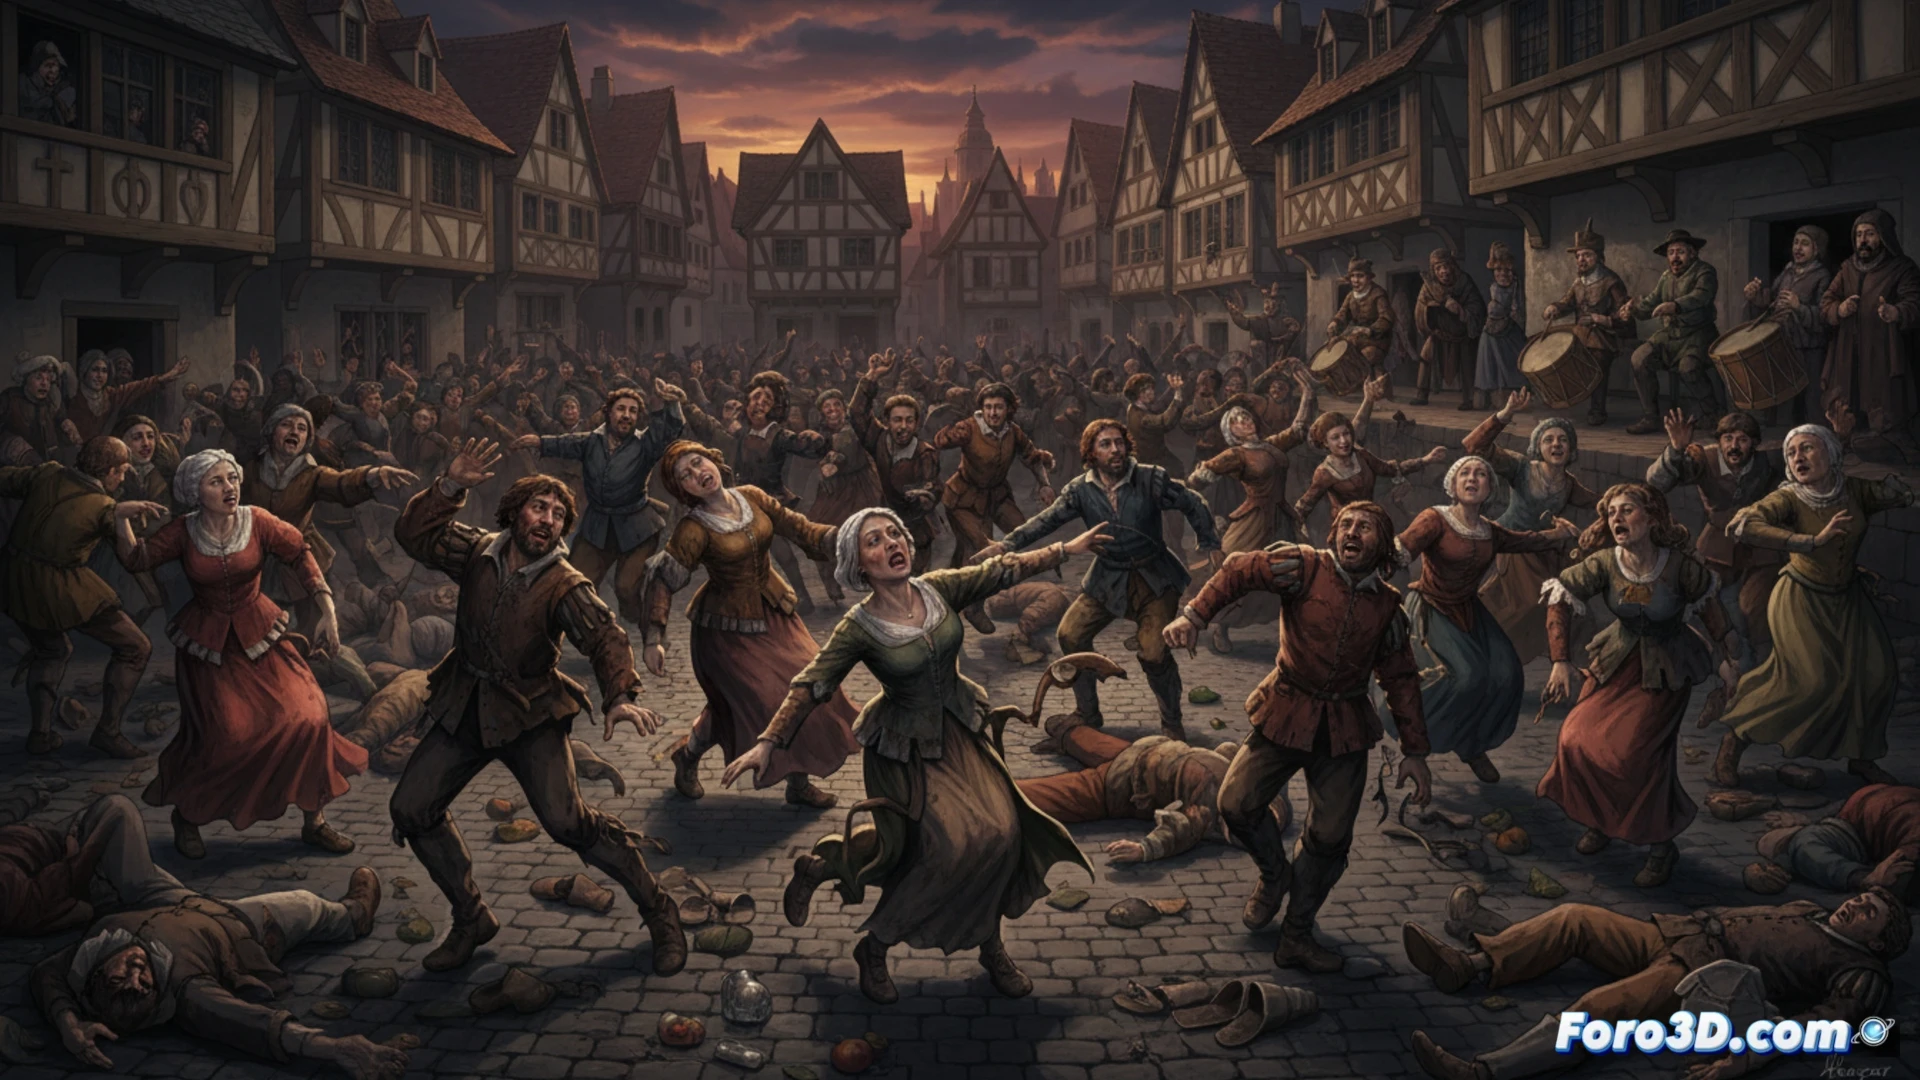
In July 1518, Strasbourg was the scene of one of the most enigmatic phenomena in the history of public health: the so-called Dancing Plague. Hundreds of people, driven by a compulsive and uncontrollable urge, danced for days and weeks without rest, leading many to death from exhaustion, heart attacks, or accidents. This event, traditionally attributed to mass hysteria, represents a unique case study for epidemiological analysis from a modern visual and spatial perspective.
Epidemiological Visualization in 3D: Reconstructing the Spread 🗺️
The proposal is to develop an interactive 3D model of 16th-century Strasbourg to map this outbreak. This model would overlay layers of key information: the location of the index case, the temporal and geographical progression of those affected, and demographic data such as neighborhoods, professions, and socioeconomic level. The tool would allow for visualizing hypothetical social contagion routes, simulating the epidemic curve of affected individuals in real-time, and correlating hotspots with stress factors of the era, such as famines and political crises, offering a dynamic understanding of how the psychogenic behavior spread.
Lessons from the Past for Risk Communication 🧠
Beyond historical reconstruction, this project underscores the power of 3D tools for public health outreach. By transforming historical data into a visual and immersive narrative, it facilitates the understanding of complex mass psychology phenomena. It serves as a reminder that epidemics are not only biological, and that data visualization is crucial for communicating risks, debunking unfounded panics, and analyzing social vulnerability in the face of collective crises, both ancient and modern.
How can 3D modeling and crowd dynamics simulation help us understand the spread and social factors of the 1518 Dancing Plague as a phenomenon of mass hysteria?
(PS: at Foro3D we know that the only epidemic that affects us is a lack of polygons)